|
||
|
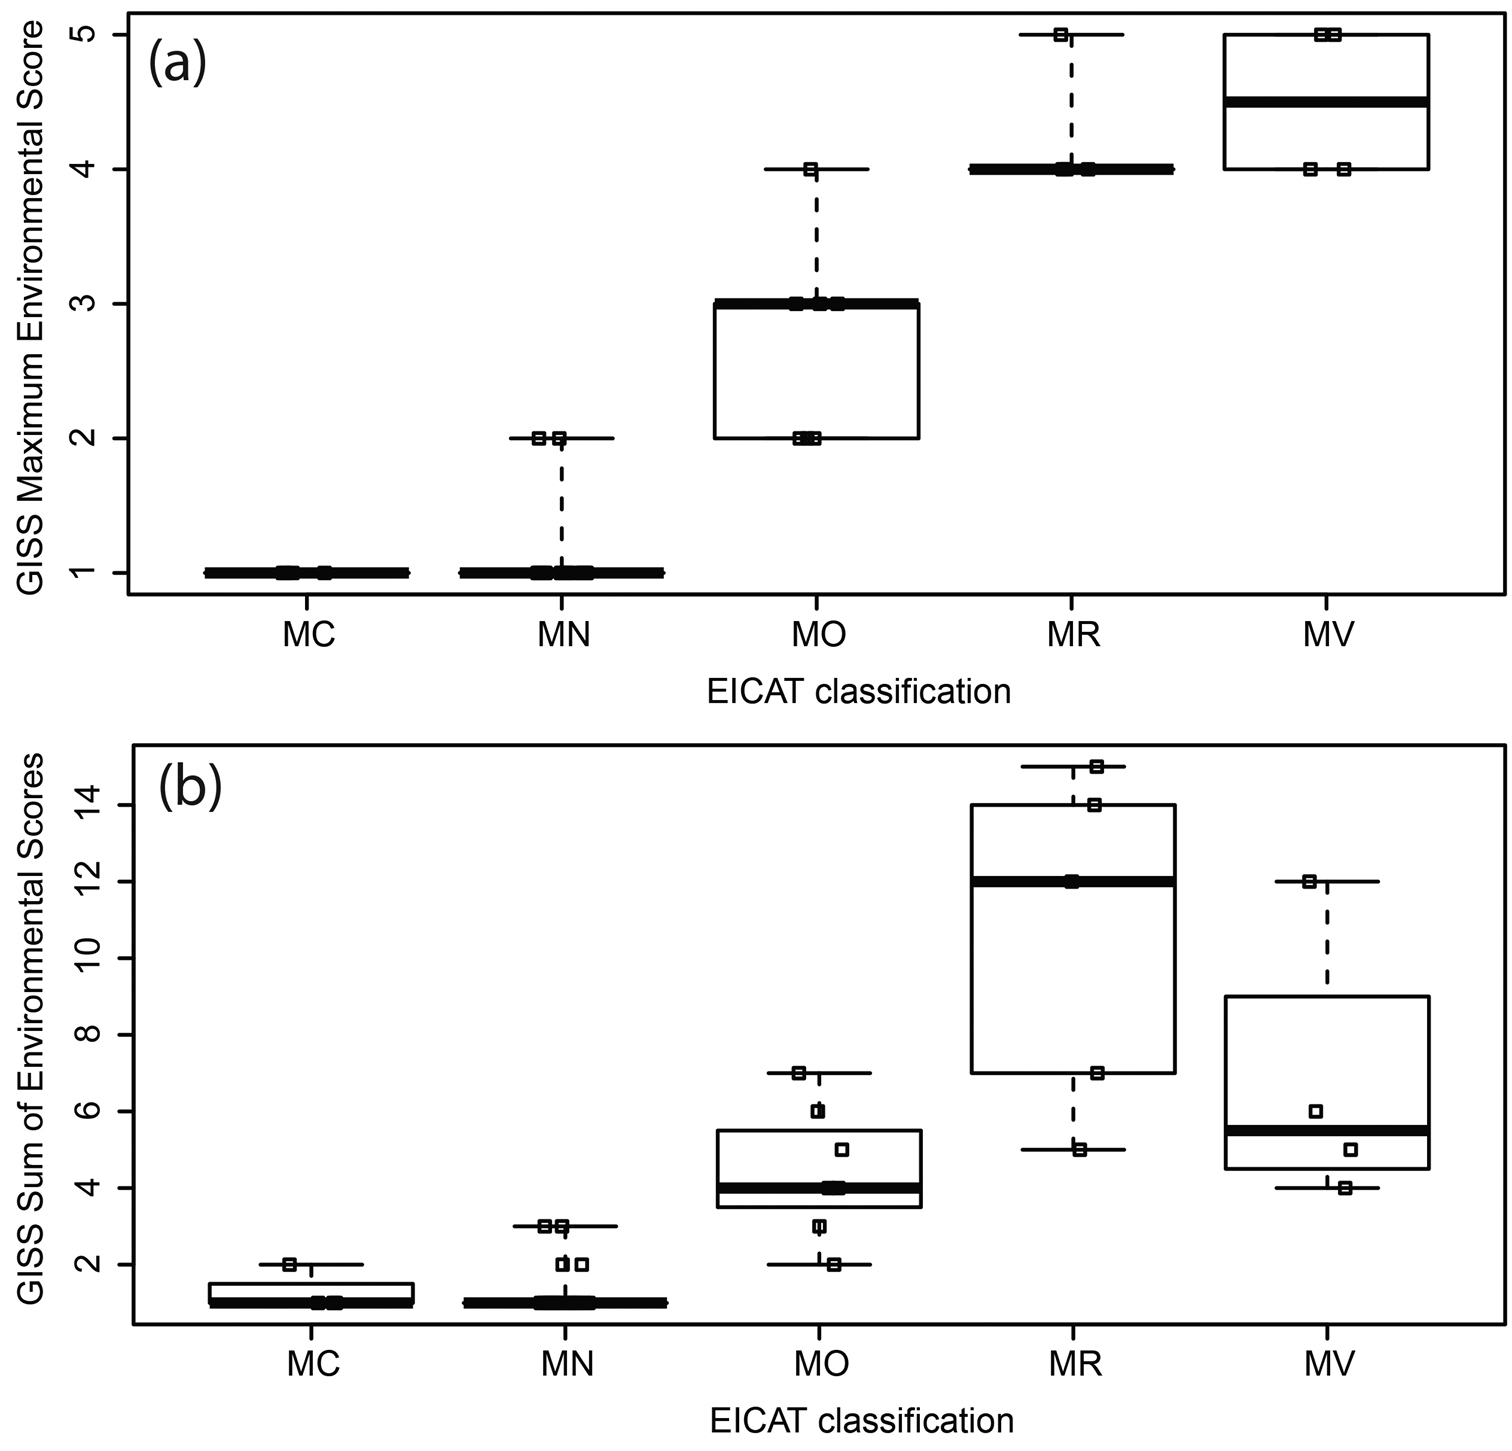
Boxplots showing how aGISS maximum scores and b the sum of all GISS environmental scores are related to EICAT classifications. Individual data points represent different species (with a jitter effect to prevent overlapping), and show the entire range of data in all groups. |