|
||
|
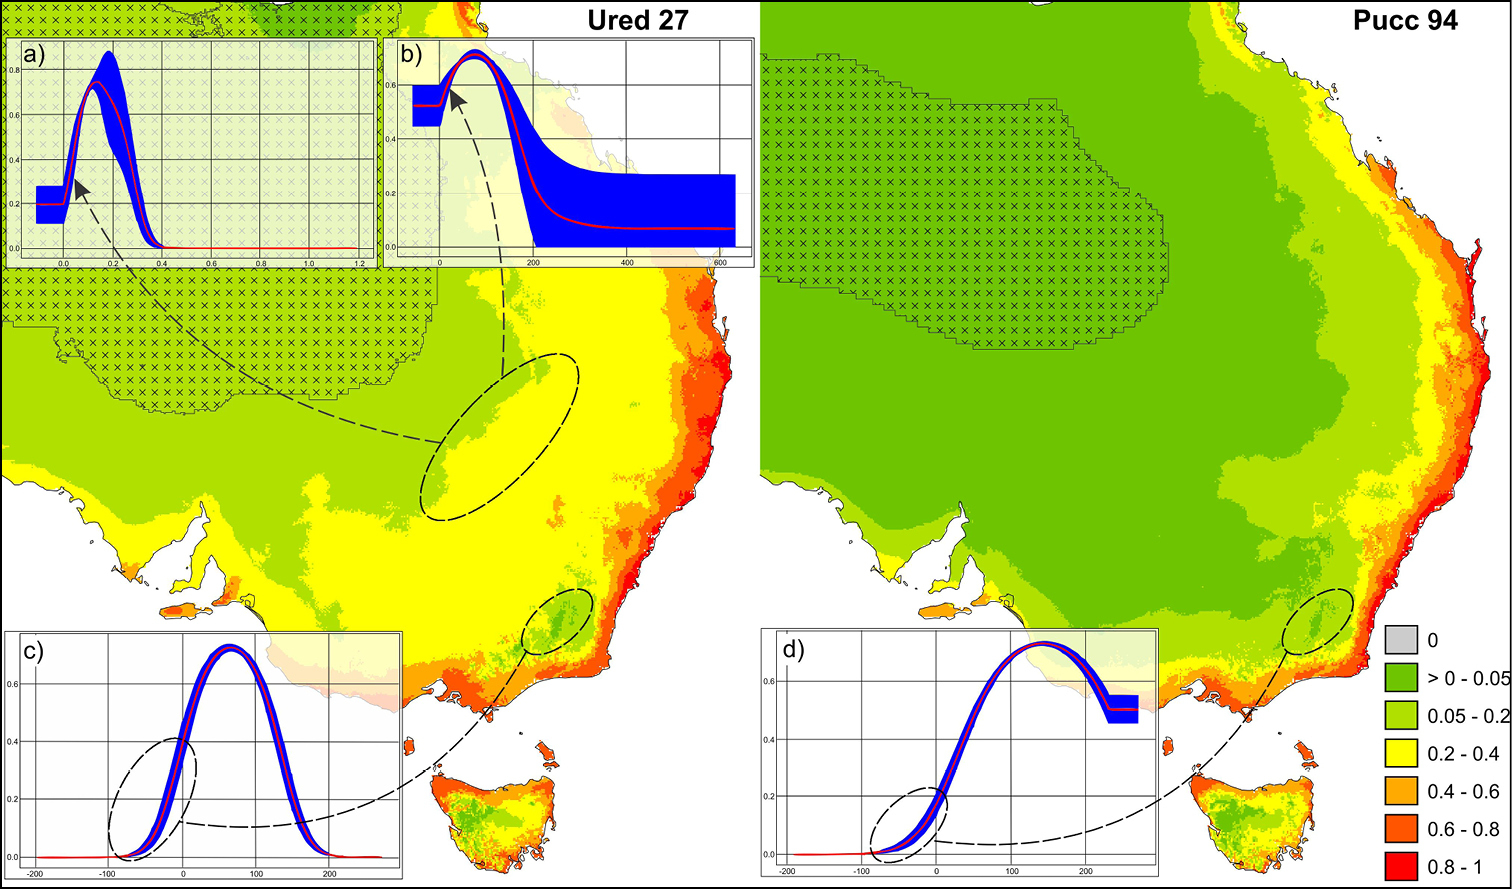
Risk maps of modelled climate suitability and selected fitted response curves from Elith et al. (2013), for two models: Ured_27 (trained with 27 locations from records classified as Uredo rangelii) and Pucc_94 (trained with 94 location records for specimens classified as Puccini psidii). See Elith et al. (2013) for further methodological details. The cross-hatched areas are novel compared with the covariate background used to generate the respective models (based on MESS map analysis; Elith et al. 2010), indicating areas of model extrapolation. Maps and fitted response curves have been annotated with examples to indicate the likely impacts of the chosen clamping and model response curve constraints; a aridity b precipitation of the driest month c and d minimum temperature of the coldest month. Inland areas of the Ured_27 model are modelled unfeasibly as having areas of relatively high suitability in excessively dry climates. In c and d, the fitted quadratic response functions asymptote, rather than intersect the origin, leading to biologically unfeasible modelled climate suitability in excessively cold areas (Kriticos et al. 2013). |