|
||
|
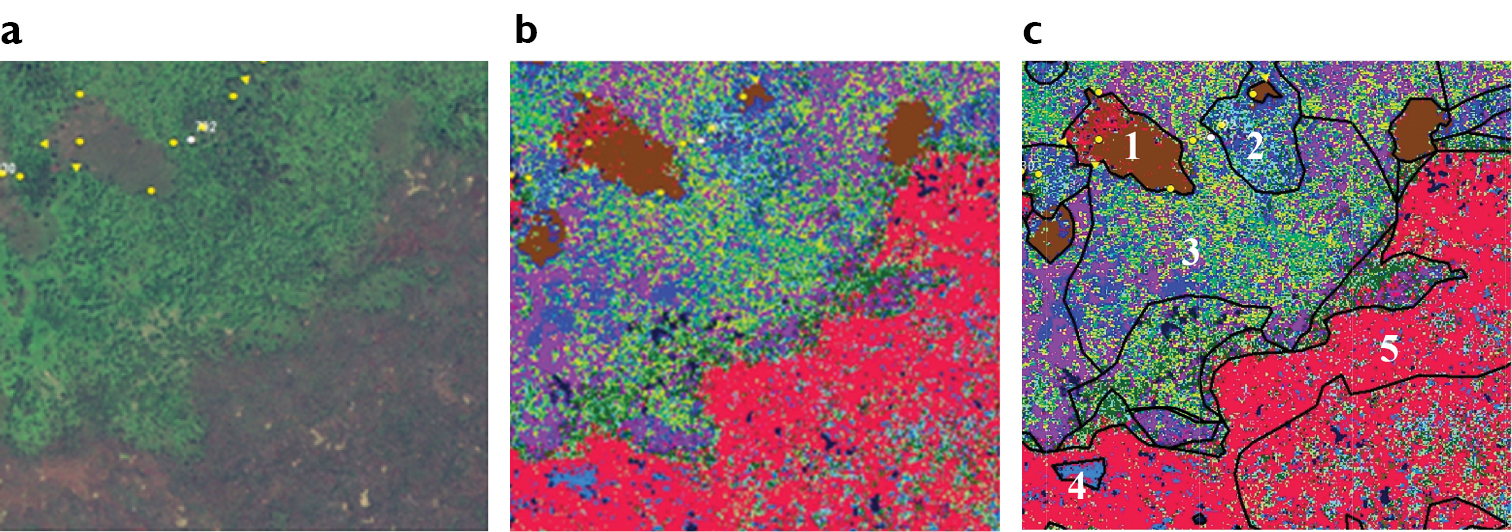
Polygons were manually delineated using a visual interpretation of satellite imagery (a: extract of Worldview-2 19th October 2011) and a classification of the imagery (b: Blue – Persea americana, Mid green – Scalesia pedunculata, Yellow – Cestrum auriculatum, Light Blue – Psidium guajava, Brown – Pennisetum purpureum, Red – Pteridium arachnoideum, Purple – Rubus niveus, Dark green – Cinchona pubescens, Dark blue – wet depressions of mixed species). Each polygon (c) was assigned attributes for the level of density of each class/species present. For example, polygon 1 had P. purpureum dominant; polygon 2 had P. americana and P. guajava co-dominant with C. pubescens scattered; polygon 3 had S. pedunculata dominant, with R. niveus secondary and C. auriculatum and P. americana scattered; polygon 4 had P. guajava dominant; polygon 5 had P. arachnoideum dominant and P. guajava scattered. |