|
||
|
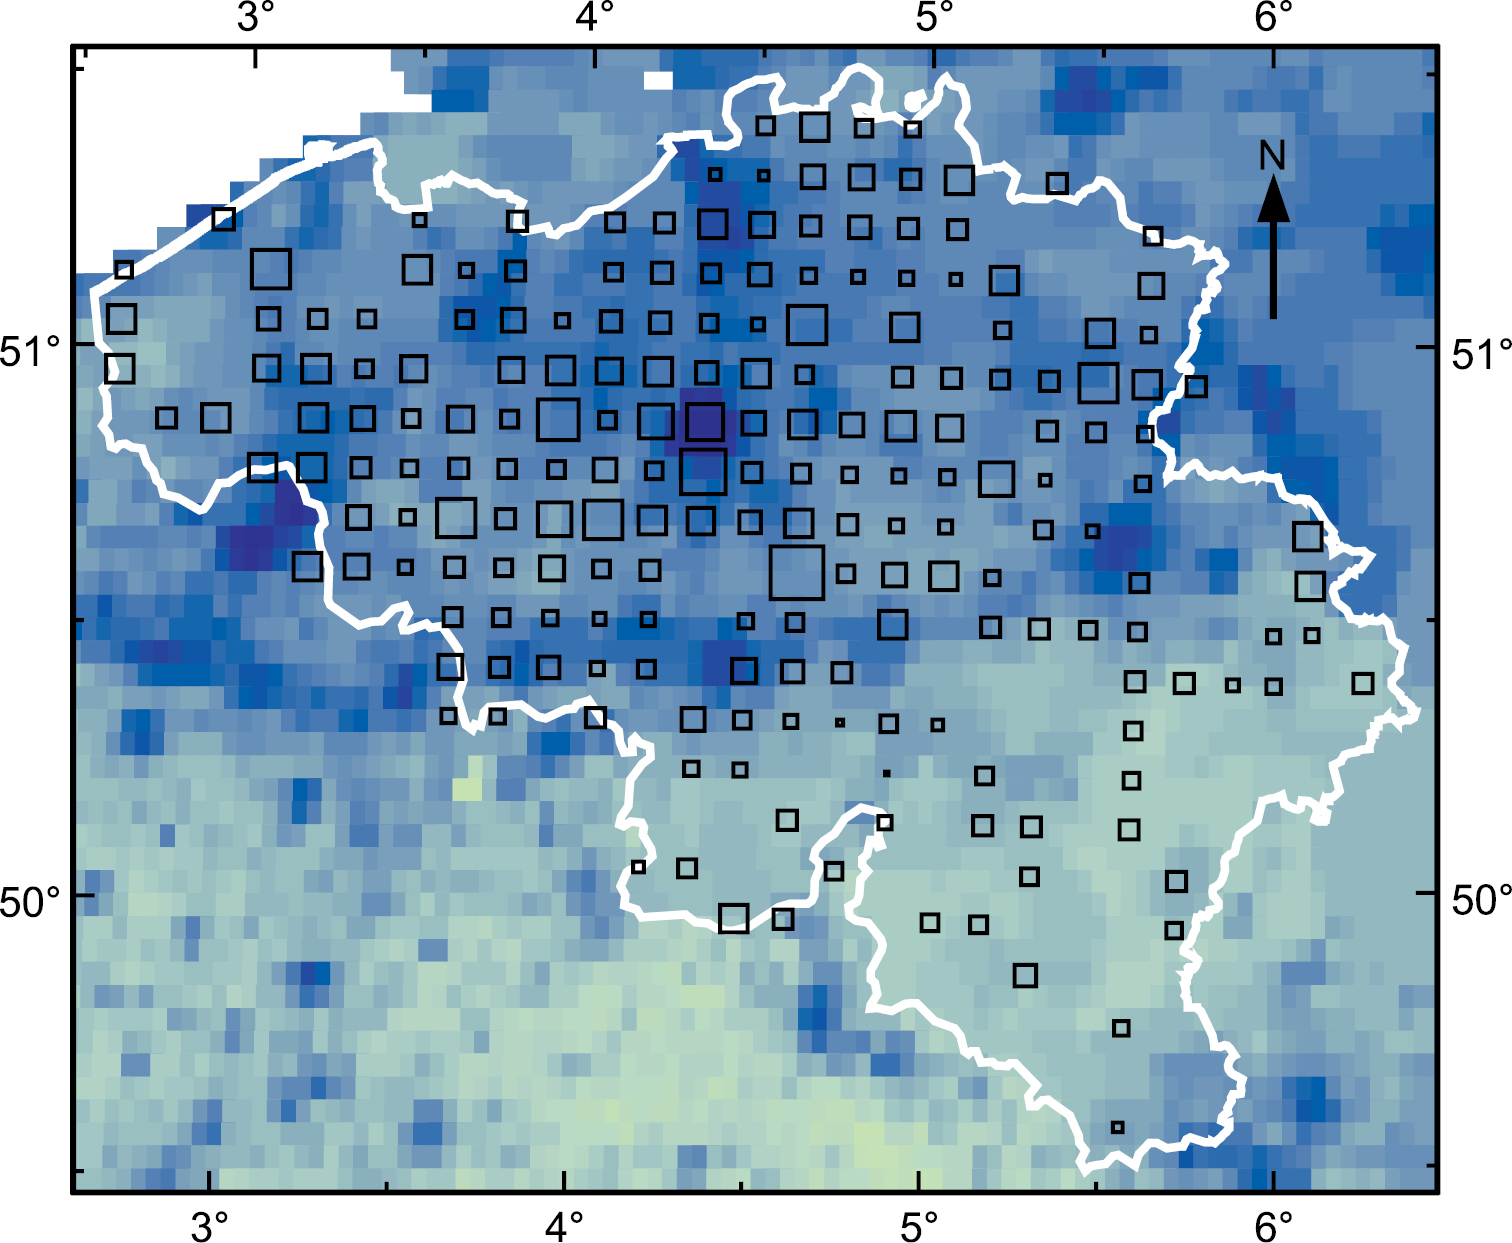
Incidence of D. invadens in Belgium (white outline) 1968–83. Based on surveys by Van Goethem et al. (1984). Size of the square in each 10 km grid square is proportional to the ratio of the number of records of D. invadens to that of D. reticulatum (the very few squares with no record of D. reticulatum show no symbol). This is superimposed on a map of population density (pale green = low, dark blue = high; same source as in Fig. 1). |