|
||
|
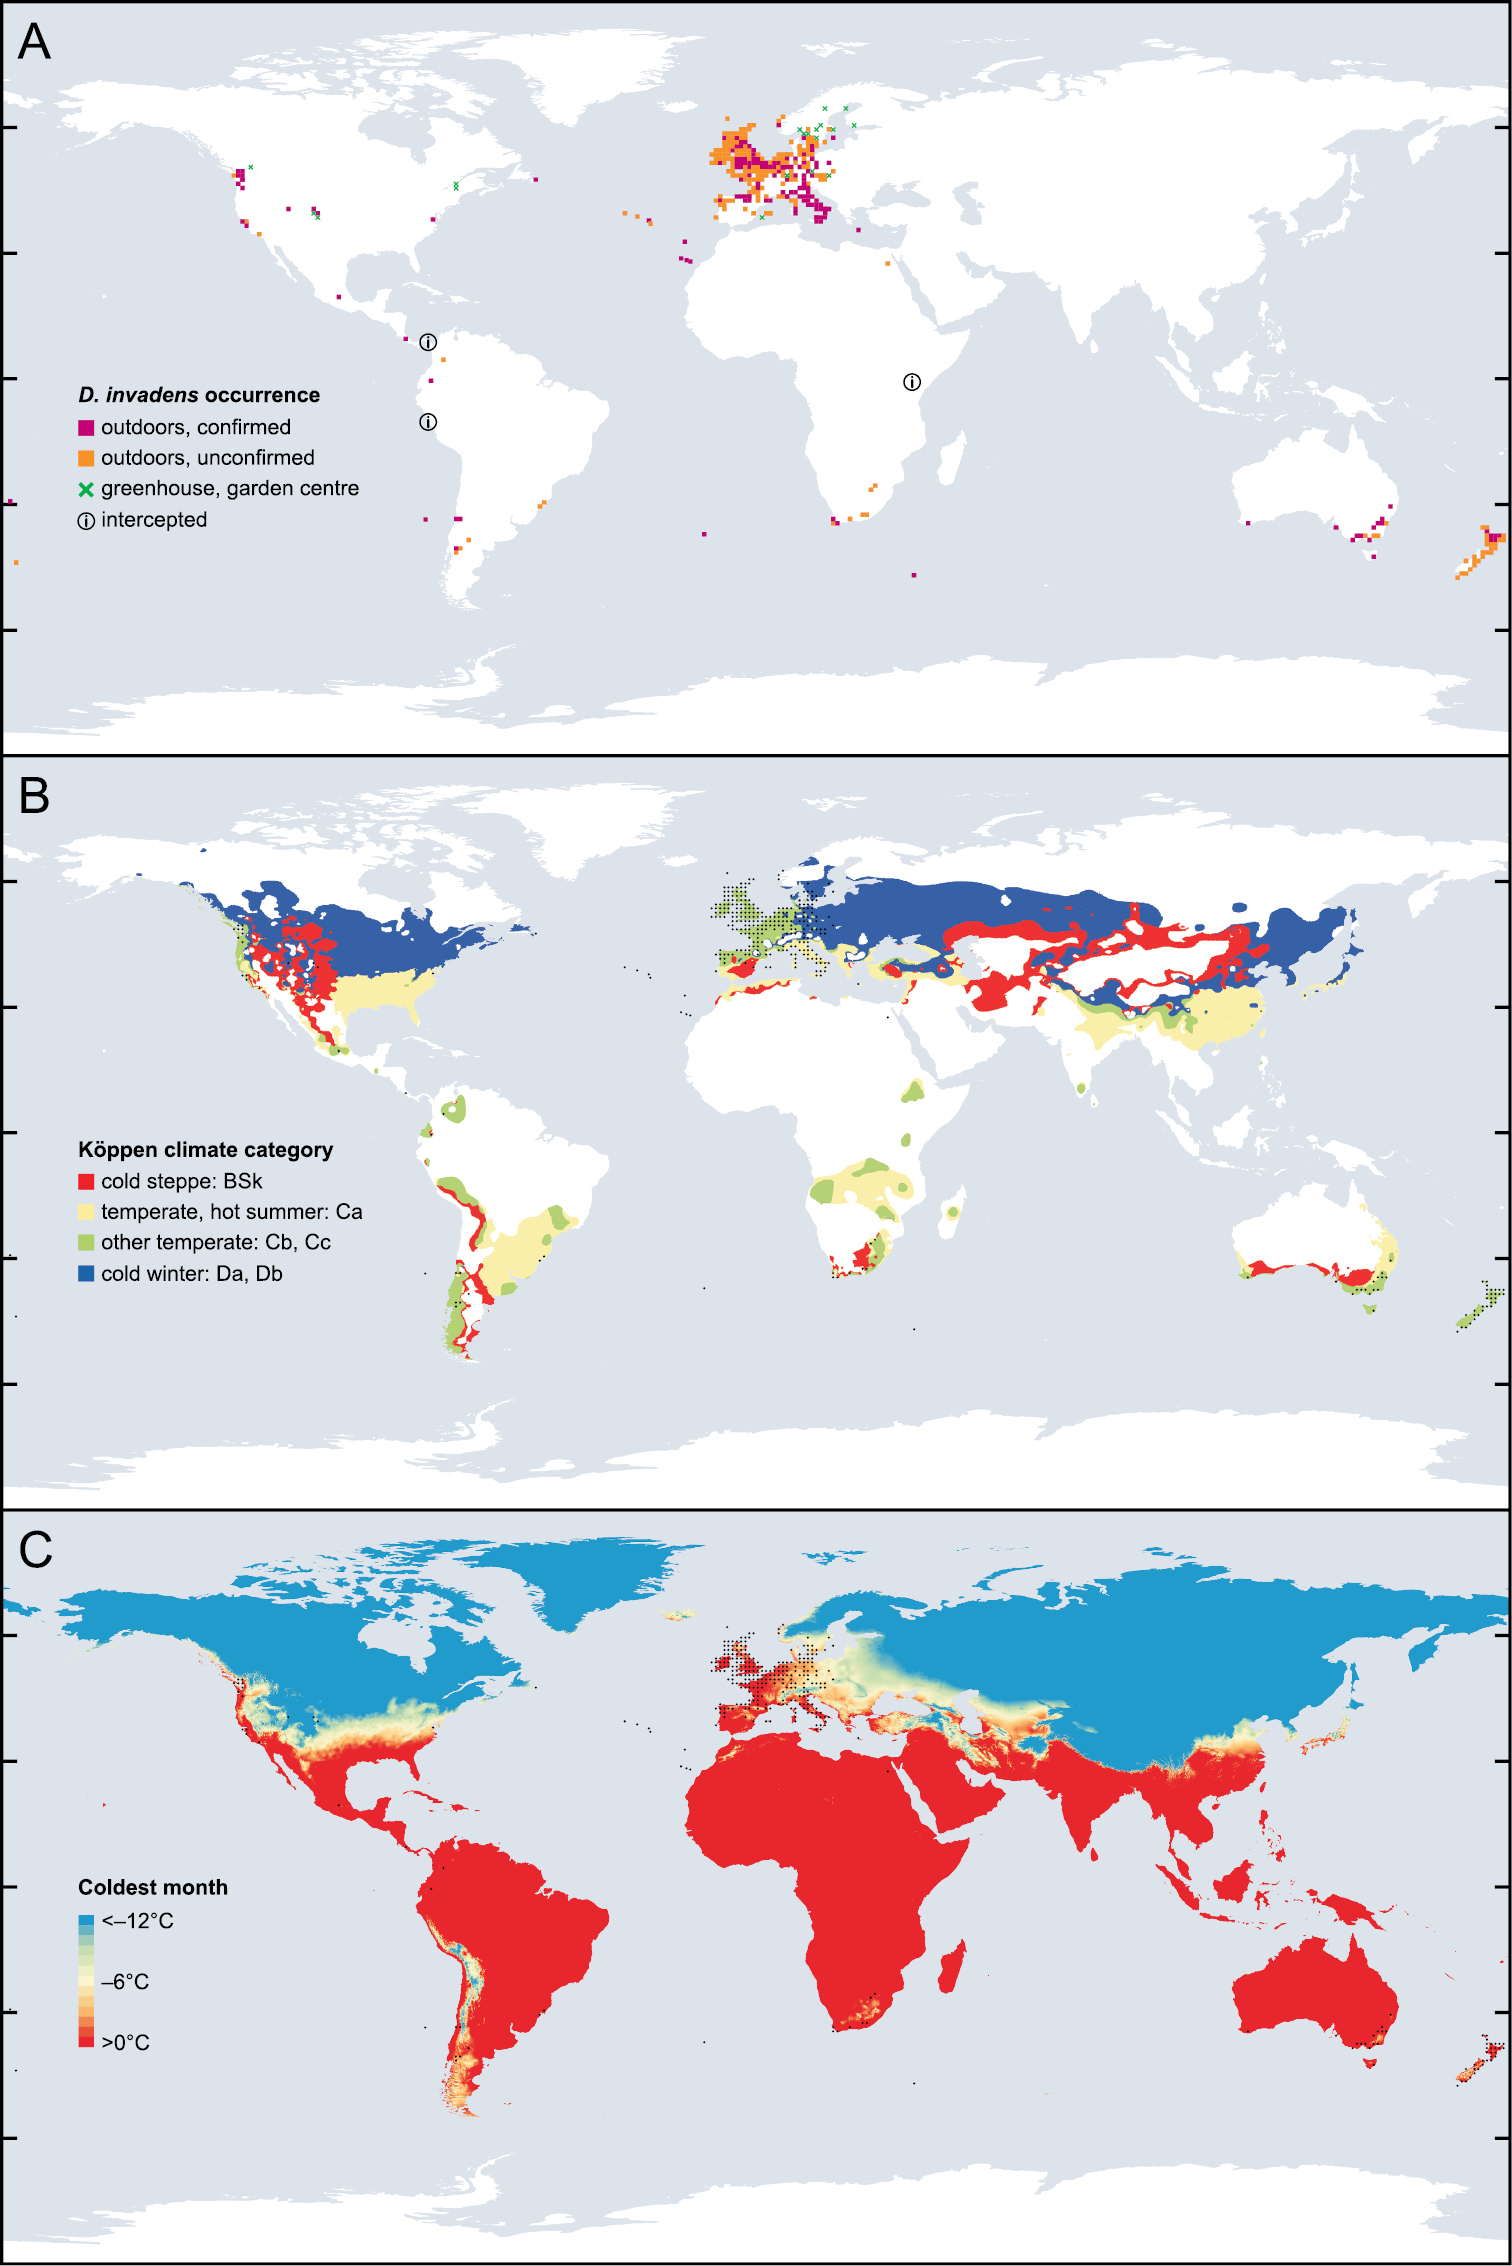
The global distribution of D. invadens related to climate. A Each symbol represents presence of D. invadens on a grid of one degree of latitude and longitude; exceptions are small oceanic islands (single symbol for each island group) and when records specify only a region which overlaps the grid lines (California, N Norway, Öland, and interceptions; a single symbol is marked in a representative “square”). Green cross = records only from greenhouse or garden centre; orange or magenta square = any other record (including garden or park); magenta indicates that at least one record has been confirmed to be D. invadens rather than D. panormitanum s.s.; circled i = only evidence of presence is interception on produce exported from that country. Swedish records in Waldén (2007) are taken to be from greenhouses. In regions where there has been taxonomic confusion (Italy, Balkans, Australia), we have excluded records not verified by ourselves (exceptions are a COI sequence from Crete, and data in Barker (1992) and Altena and Smith (1975) confirmed by dissection) B The squares in A are replaced by black dots, and these are superimposed on a map of the most relevant Köppen climate categories, as modified and interpolated by Peel et al. (2007). Cb + Cc = temperate with warm or cold summer (Th < 22 °C, 0 °C < Tc < 18 °C). Ca = temperate with hot summer (Th > 22 °C, 0 °C < Tc < 18 °C). Da + Db = cold winter, with hot or warm summer (Tc < 0 °C, Th > 22 °C or NT>10 ≥ 4). BSk = cold steppe (5 PT < P < 10 PT, Tm < 18 °C). Th = temperature of hottest month, Tc = temperature of coldest month, Tm = mean annual temperature, NT>10 = number of months when temperature is above 10 °C, P = annual precipitation, PT = constant set by Tm and timing of precipitation C The squares in A are replaced by black dots, and these are superimposed on a map indicating winter temperature. For each calendar month, the mean of the daily minimum temperature was calculated, this was averaged over years, and the lowest value amongst the calendar months used (Hijmans et al. 2005; http://www.worldclim.org/ accessed 01.x.2013). Maps created in QGIS 2.0.1 (QGIS Development Team 2013) using outlines from Natural Earth. |