|
||
|
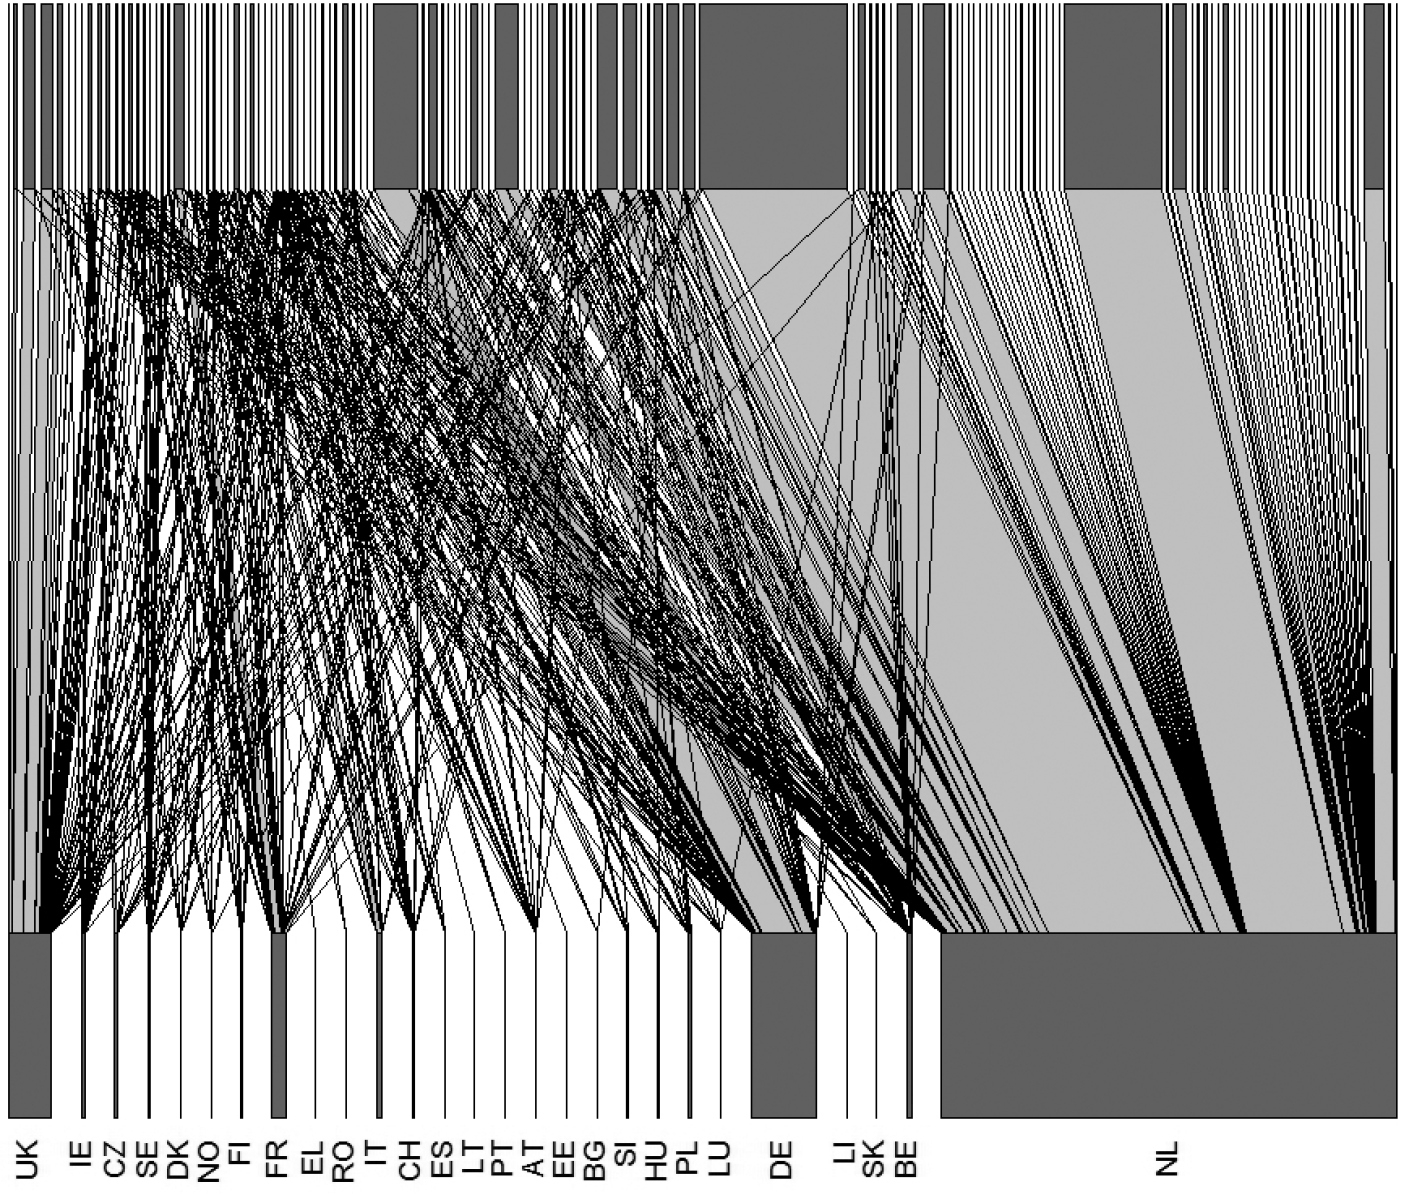
Trade flow of Acer plants from individual producers in the Boskoop demarcated area in 2009. Producers are represented by the grey bars on the top of the figure and destination countries by grey bars at the bottom, and the lines between the bars at the top and bottom of the figure indicate the trade in Acer plants. The width of the bars and lines indicates the number of plants. The realised fraction of possible linkages between producers and destination countries is 11.3% and 36.7% of the producers only shipped plants to destinations within the Netherlands. |