NeoBiota 21: 49–63, doi: 10.3897/neobiota.21.4966
Colonization of Brazil by the cattle egret (Bubulcus ibis) revealed by mitochondrial DNA
Emmanuel Moralez-Silva 1, Sílvia Nassif Del Lama 1
1 Departamento de Genética e Evolução, Universidade Federal de São Carlos, Rod. Washington Luis Km 235, SP-310, São Carlos, São Paulo, Brazil

Corresponding author: Sílvia Nassif Del Lama (dsdl@ufscar.br)

Academic editor: J. Kollmann

received 5 March 2013 | accepted 25 July 2013 | Published 17 April 2014
(C) 2014 Emmanuel Moralez-Silva. This is an open access article distributed under the terms of the Creative Commons Attribution License (CC BY 4.0), which permits unrestricted use, distribution, and reproduction in any medium, provided the original author and source are credited.
For reference, use of the paginated PDF or printed version of this article is recommended.

Citation: Moralez-Silva E, Del Lama SN (2014) Colonization of Brazil by the cattle egret (Bubulcus ibis) revealed by mitochondrial DNA. In: Capdevila-Argüelles L, Zilletti B (Eds) Proceedings of 7th NEOBIOTA conference, Pontevedra, Spain. NeoBiota 21: 49–63. doi: 10.3897/neobiota.21.4966

Abstract

The cattle egret (Bubulcus ibis) has recently colonized Brazil. This process offers an excellent opportunity for the study of colonization and dispersal patterns across extensive areas by non-native birds. The aims of the present investigation were a) to determine the genetic diversity of the cattle egret in Brazil and Africa, b) evaluate genetic differentiation between populations in different regions of Brazil and Africa, and c) detect genetic signs of demographic expansion in these two areas. Mitochondrial DNA (mtDNA) Control Region (CR) sequences were obtained from 112 cattle egrets in four Brazilian and four African (Kenya, Ghana and Nigeria) populations. Genetic diversity (H, h, θs) and population structure (AMOVA, Fst) were assessed and the populations were tested for signs of recent demographic expansion. A total of 35 haplotypes were found: 22 exclusive to Africa, 10 exclusive to Brazil and three shared by both samples. The degree of genetic diversity, determined by mtDNA analysis, was similar between Brazil and Africa, demonstrating that the successful colonization of the non-native area occurred with no significant loss of diversity. The pairwise Fst values among the Brazilian and African populations were all significantly different. The population in southern Brazilian exhibited the lowest degree of differentiation with respect to the African population, followed by the southeastern and northeastern populations of the country. The genetic differentiation data suggest that the colonization of Brazil by the cattle egret began in the southern region and expanded to the southeastern and northeastern regions of the country. This genetic differentiation pattern is in accordance with the higher number of cattle per grazing area in southern Brazil, which may have favored the onset of the successful establishment of the species. The findings indicate that mtDNA genetic diversity was retained during the colonization process and colonization began in the southern region of the country. Moreover, signs of demographic expansion were detected in the African sample.

Keywords

Cattle egret, colonization, control region, dispersal, diversity

Introduction

The cattle egret (Bubulcus ibis Linnaeus, 1758) primarily inhabits grassland habitats and forages in close association with grazing animals, such as cattle and other livestock, and it is classified in three subspecies. The subspecies Bubulcus ibis ssp. is native to tropical and subtropical Africa, southern Europe and western Asia (Brown et al. 1982). A number of bird species have been introduced to non-native areas through human intervention. However, the cattle egret is known to have established and expanded to the Americas without such intervention (Telfair 1983). This bird is considered an invasive species according to the International Union for Conservation of Nature’s Invasive Species Specialist Group (ISSG) and is also listed among the invasive alien vertebrate species in the Galapagos Islands (Phillips et al. 2012). Although many details of its expansion are unknown, cattle egret populations from West Africa or southern Europe are thought to be the origin of populations in the Americas (Telfair 1983, Valverde 2003). Egrets that probably crossed the Atlantic Ocean were first recorded in coastal areas of northern South America (Palmer 1962, Wetmore 1963). The first sightings in the New World were reported for Suriname (Dutch Guiana, Palmer 1962) between 1877 and 1882, followed by sightings in British Guiana and Colombia (Wetmore 1963) and subsequent expansion throughout the Americas. In Brazil, the cattle egret was first recorded in the northern region of the country in 1964, feeding along with buffalos on Marajó Island in the state of Pará (Sick 1965). By 1973, its occurrence was reported in the state of Rio Grande do Sul (southern Brazil) (Belton 1974).

By approximately 1900, the cattle egret had also expanded its range in Africa (Telfair 1983). The species was first recorded in the Cape Peninsula of South Africa in 1867 (Skead 1952, Siegfried 1965). According to Chapin (1932), between 1920 and 1930, the breeding range of the cattle egret was restricted to the extreme north of Africa on the Mediterranean coast and a narrow sub-Saharan west-to-east corridor, descending through a broad area on the eastern coast, including Kenya, South Africa, Madagascar and the Comoro islands.

Novel colonizers can cause problems outside of their native range. While the cattle egret is not currently a threat to native fauna in Brazil throughout most of its geographic distribution, it has the potential to produce adverse effects, as evidenced by its occupation of island environments. For example, in the Fernando de Noronha archipelago, the cattle egret drives adult native seabirds from their nests in breeding colonies (Barbosa-Filho et al. 2009) and predates the Noronha skink (Euprepis atlanticus), which is endemic to the archipelago (Silva-Jr. et al. 2004). Similar behavior is seen in Hawaii, where predation by cattle egrets on the chicks of native waterbirds, such as the black-necked stilt (Himantopus mexicanus), has been reported (Stone and Anderson 1988).

Successful establishment in a new area by a novel colonizing species is determined by several factors, such as reproductive capacity, growth rate and suitable environmental features (Blackburn et al. 2009). When the invasive population grows exponentially in the non-native area and the landscape is uniform, the diffusion of individuals across the newly occupied area is random and the colonization front is expected to advance at a constant spread rate (Skellam 1951). This dispersion pattern is not expected for the cattle egret in Brazil due to the lack of uniformity in the landscape. During colonization, the habitat match is an important factor to consider because it can determine the selection of areas to be occupied by invasive species (Hayes and Barry 2008). The state of Rio Grande do Sul in southern Brazil is the only region of the country with extensive areas of natural grasslands within the “Pampas” biome (taken from MMA) and had the largest bovine breeding activities in the 1970s (census data; IBGE 1975), which are similar to conditions found for the cattle egret in its native range.

Genetic tools can provide data that assist in clarifying the process of colonization of non-native areas by alien species. Mitochondrial DNA (mtDNA) has been used in many studies on invasive species to identify historical introduction pathways or determine likely sources of introduced populations (e.g., Corin et al. 2007, Hoos et al. 2010). Rollins et al. (2011) clarified the invasion pathways of the common starling (Sturnus vulgaris) in Western Australia based on mtDNA data. According to the authors, mtDNA markers are useful for tracking dispersal in populations and can help predict future population expansions of an alien species. The evaluation of diversity patterns using neutral molecular markers is helpful to the investigation of species invasion (Yonekura et al. 2007). Genetic comparisons between populations in native and non-native areas may indicate different distribution patterns of genetic diversity that are interpreted as consequences of distinct phenomena (Allendorf and Lundquist 2003). A significant reduction in genetic variability in populations that have occupied non-native areas would be interpreted as a consequence of the founder effect, while a more diverse population in a non-native area than in the source population would be the result of an admixture of differentiated source populations (Kolbe et al. 2004, Lockwood et al. 2005, Colautti et al. 2006). Reductions in genetic variability in non-native vs. native ranges have been recorded for other bird species (Hawley et al. 2006, Rollins et al. 2011). The opposite pattern has also been described (Beneteau et al. 2012). Similar levels of genetic diversity in populations from non-native and native areas can be found when the entrance of a high number of founders occurred during a recent colonization or as the result of continuous migration between the source and colonized populations.

The aim of the present study was to investigate the colonization of Brazil by the cattle egret through the use of mtDNA Control Region (CR) sequences. Inferences are based on four Brazilian samples from different latitudes and four African samples in a more limited geographic area. The cattle egret has considerable dispersal potential and low fidelity to breeding sites (Telfair 1983), which are characteristics that favor a lack of structuring among populations. Based on historic records and background knowledge, three hypotheses are put forth: 1) supposing cattle egret populations are not genetically differentiated in their native area, we hypothesize that genetic diversity in the four Brazilian populations will be lower or comparable to that found in the African population; 2) colonization of Brazil was directed by habitat match, with the cattle egret drawn to the southern region of the country due to the more frequent occurrence of cattle raising and extensive pasture areas, despite the fact that the entrance of the species in South America occurred in the northern region; and 3) genetic signs of demographic expansion could be detected in both Africa and Brazil populations, but genetic evidence of this process may not be detected due to the fact that range expansion occurred in recent times, especially in Brazil.

Methods
Sampling, DNA extraction and sequencing

Two types of biological samples were obtained for the study: blood samples were collected from nestlings in breeding colonies and molted feathers were collected beneath nests in breeding colonies. All sampling sites were reproductive colonies, except the Kankun National Park in Ghana, which is a roosting site. Blood samples (one per nest) were collected from each colony, pooled and each group was considered a single population, i.e., a group of individuals resulting from random interbreeding. The Brazilian samples (N = 51) consisted only of blood samples collected from breeding colonies and all African samples (N = 61) consisted of molted feathers (see Table S1 in Appendix for the complete list of locations sampled). Only feathers in good condition and with no signs of physical degradation were analyzed (Hogan et al. 2008). To avoid the collection of more than one feather from the same individual, only feathers separated by more than 3 m from each other were collected and no genotype was found twice among the feathers analyzed, except for Hap 14. DNA sequences obtained from blood and feathers had similar Phred quality scores. Total genomic DNA was extracted from blood samples following proteinase K digestion and using a phenol/chloroform/isoamylic alcohol protocol (Sambrook and Russell 2001). DNA was extracted from feather samples using the protocol described by Miño and Del Lama (2009), without the addition of SDS.

A fragment of 430 bp of the domain I of the CR mtDNA was amplified for 112 cattle egret samples using primers developed in the present study: Ardea L3 (5’-CAC CTA ACA CAA AAC ACA AAC-3’) and BiDIH4 (5’-CTT CAG ATA CCG GTA CTT C-3’). Polymerase chain reactions were conducted in a total volume of 12.5 µL containing 10 ng of template DNA, PCR buffer containing 10 mM Tris-HCl, 50 mM KCl, 20 mM ((NH4)2SO4 and 2 mM MgCl2 (pH 9.0), 0.25 µM of each dNTP, 0.10 µM of each primer and 1 U of Taq DNA Polymerase (Biotools B&M Labs, S.A.). The cycling conditions were follows: denaturation for 5 min at 94 °C; 5 cycles of 94 °C for 30 s, 60 °C for 30 s and 72 °C for 1 min; 20 cycles of 94 °C for 30 s, 58 °C for 30 s, decreasing 0.1 °C per cycle; 10 cycles of 94 °C for 30 s, 45 °C for 30 s and 72 °C for 1 min; and a final extension at 72 °C for 10 min. The amplified fragments were sequenced in an ABI Prism 3730 sequencer (Applied Biosystems Inc., California, USA). Sequences were initially aligned with CLUSTALW (Larkin et al. 2007). Alignments were verified by eye and trimmed using the BIOEDIT v7.0 (Hall 1999) software program.

Statistical analyses

Genetic diversity was examined by calculating the number of haplotypes (H), haplotype diversity (h) and molecular diversity (θ). Genetic diversity estimates were calculated using the ARLEQUIN program v3.5 (Excoffier and Lischer 2010). The molecular diversity estimator theta (θ) is equal to 2 Mµ, in which M is the population size of the haploid populations and µ is the overall mutation rate. The overall mutation rate can be estimated using different approaches that employ nucleotide diversity (θπ), the number of polymorphic sites (θs) or the number of haplotypes (θk). Comparisons of the diversity among the African and Brazilian populations were based on θs, since the θπ estimate reflects demographic changes in the more distant past and the interest of the present study was in changes over very recent time spans (approximately 100 generations), as proposed by Rollins et al. (2011). Both θs and θk are sensitive to recent demographic history and depend on assumptions of selective neutrality, constant population size and adherence to the appropriate mutational model (“infinite sites” model for θs and “infinite alleles” model for θk). The decision was made to use θs due to the fact that the “infinite sites” model of mutation is normally applied to DNA sequence data (Tajima 1996). The population structure was analyzed using analysis of molecular variance (AMOVA) and pairwise Fst values were calculated using the ARLEQUIN program v3.5 (Excoffier and Lischer 2010).

Relationships among haplotypes were inferred through the construction of a statistical parsimony network by the TCS v1.21 program (Clement et al. 2000). Ambiguous connections in the statistical parsimony network (loops) were solved using a hierarchical set of guidelines based on coalescent criteria (Crandall and Templeton 1993). The jMODELTEST v0.1.1 (Posada 2008) program was used to select the best-fitting nucleotide substitution model from among three substitution-type models, using both the Akaike information criterion (AIC) (Akaike 1974) and the Bayesian information criterion (Schwarz 1978).

Deviation from selective neutrality was tested using Fu’s Fs (Fu 1997) and Tajima’s D (Tajima 1989) tests. Fu and Li’s D* and F* statistics (Fu and Li 1993) and the R2 statistic (Ramos-Onsins and Rozas 2002) were also computed to test for deviation from selective neutrality using the DNASP v5 program (Librado and Rozas 2009). The distribution of pairwise nucleotide differences (mismatch distribution) was calculated as an additional test for demographic expansion (Rogers and Harpending 1992), also using the DNASP program. To test whether the observed distributions significantly deviated from those expected under the population expansion model, the sum of square deviations (SSD) value was calculated using the ARLEQUIN v3.5 program (Excoffier and Lischer 2010).

Results

The number of haplotypes was higher in Africa (H = 25) than Brazil (H = 13). Table 1 displays the complete list of haplotypes and frequencies in the populations. Haplotype diversity (h) (mean ± SD) was 0.85 ± 0.04 in Africa and 0.90 ± 0.02 in Brazil. Molecular diversity based on the number of polymorphic sites (θs) was 3.33 ± 1.17 in Africa and 3.11 ± 1.17 in Brazil. The African and Brazilian populations exhibited 16 and 14 polymorphic sites, respectively.

Table 1.

Number of domain I Control Region mtDNA haplotypes evidenced by distinct sequences in cattle egret (Bubulcus ibis) in two areas: A = Africa; B = Brazil.

S / H 47 69 74 114 117 148 215 242 278 288 290 294 296 316 325 373 375 378 403 413 B A
Hap1 T G G C G A T C T C C A C G C G C C A T 8 4
Hap2 . . . . . . C T C . . . T . . . T T . . 11 -
Hap3 . . . . . . . T C . . . T . . . T . . . 4 7
Hap4 . . . . . . . T . . T . T . . . T . . . 4 -
Hap5 . . . . . . . T C . . . T A . . T . . . 6 -
Hap6 . A . . . G . . C . . . T . . . T . . . 3 -
Hap7 . . . . . . . T . . . . T . . . T . . . 4 2
Hap8 . . . . . . . . . T T . . . . . T . . . 2 -
Hap9 . . . . . . . T C . . G T . . . T . . . 3 -
Hap10 . . . . . . . . . . . . T . . . T . C . 1 -
Hap11 . A . . . . . . . . . . T . . . T . . . 3 -
Hap12 . . . . . . . . C . . G T . . . T . . . 1 -
Hap13 A . . . . . . . . . T . . . . . . . . 1 -
Hap14 . . . . . . . . C . . . T . . . T . . . - 26
Hap15 . . . . . . . . . . . . . . . . T . . . - 2
Hap16 . . . . . . . T . . . . T . . . . . . - 2
Hap17 . . . . . . . T C T . . T . . . T . . . - 1
Hap18 . . . . . . . . . . . . T . . . T . . . - 2
Hap19 . . . . . . . T . . . . T . . A T . . . - 1
Hap20 . . . . . . . . . . . . T . T . T . . . - 2
Hap21 . . . . A . . . C . . . T . . . T . . . - 2
Hap22 . A . . . . . . C . . . T . . . T . . . - 1
Hap23 . . . . . . . . . T . . T . . . T . . . - 1
Hap24 . . A . . . . T C . . . T . . . T T . . - 1
Hap25 . . . . . . . . C . T . T . . . T . . . - 2
Hap26 . . . T . . . T C T . . T . . . T . . . - 1
Hap27 . . . . . . . . C . . . T . T . T T . . - 1
Hap28 . . . . . . . . C T . . T . . . T . . . - 2
Hap29 . . . . . . . . C . . . T . . . T T . . - 2
Hap30 . . . . . . . . C . . . T . . . . . . . - 2
Hap31 . . A . . . . . C . . . T A . . T T . . - 1
Hap32 . . . . . . . T C . . . T . . . . . . . - 1
Hap33 . . . . . . . . . . . . T . . . T T . . - 1
Hap34 . . . . . . . T C . . . T . . . T . . C - 1
Hap35 . . . . . . . T C . . G T . . . T . . . - 1

AMOVA revealed that 8.73% of the detected variation was explained by differences between the two populations (African and Brazilian) and the remaining 91.27% was explained by individual differences within populations. The number of haplotypes found in the four Brazilian regions ranged from eight to nine, with no descending cline from the location of the first record of the cattle egret (northern Brazil) to the most distant population sampled (southern Brazil). The pairwise Fst value between the Brazilian and African populations was 0.10. As this value was statistically significant (P< 0.05), pairwise Fst values were calculated among all eight sampling sites (data not shown). Pairwise Fst values involving only Brazilian pairs or African pairs of populations were non-significant, demonstrating no sign of population structuring within each region. The four Brazilian populations were also compared against the entire African population, considering Africa to be one of the probable sources of the Brazilian population, and possible differences in the degree of differentiation between the different Brazilian populations and the entire African population were tested. As expected, significant Fst values were found for all paired comparisons (P < 0.05). The lowest degree of differentiation in relation to the entire African population was found in the southern region of Brazil (state of Rio Grande do Sul [RS]), followed by the southeastern region (state of São Paulo [SP]), and the most differentiated region was northeastern Brazil (states of Rio Grande do Norte [RN] and Pernambuco [PE]) (Fig. 1).

Figure 1.

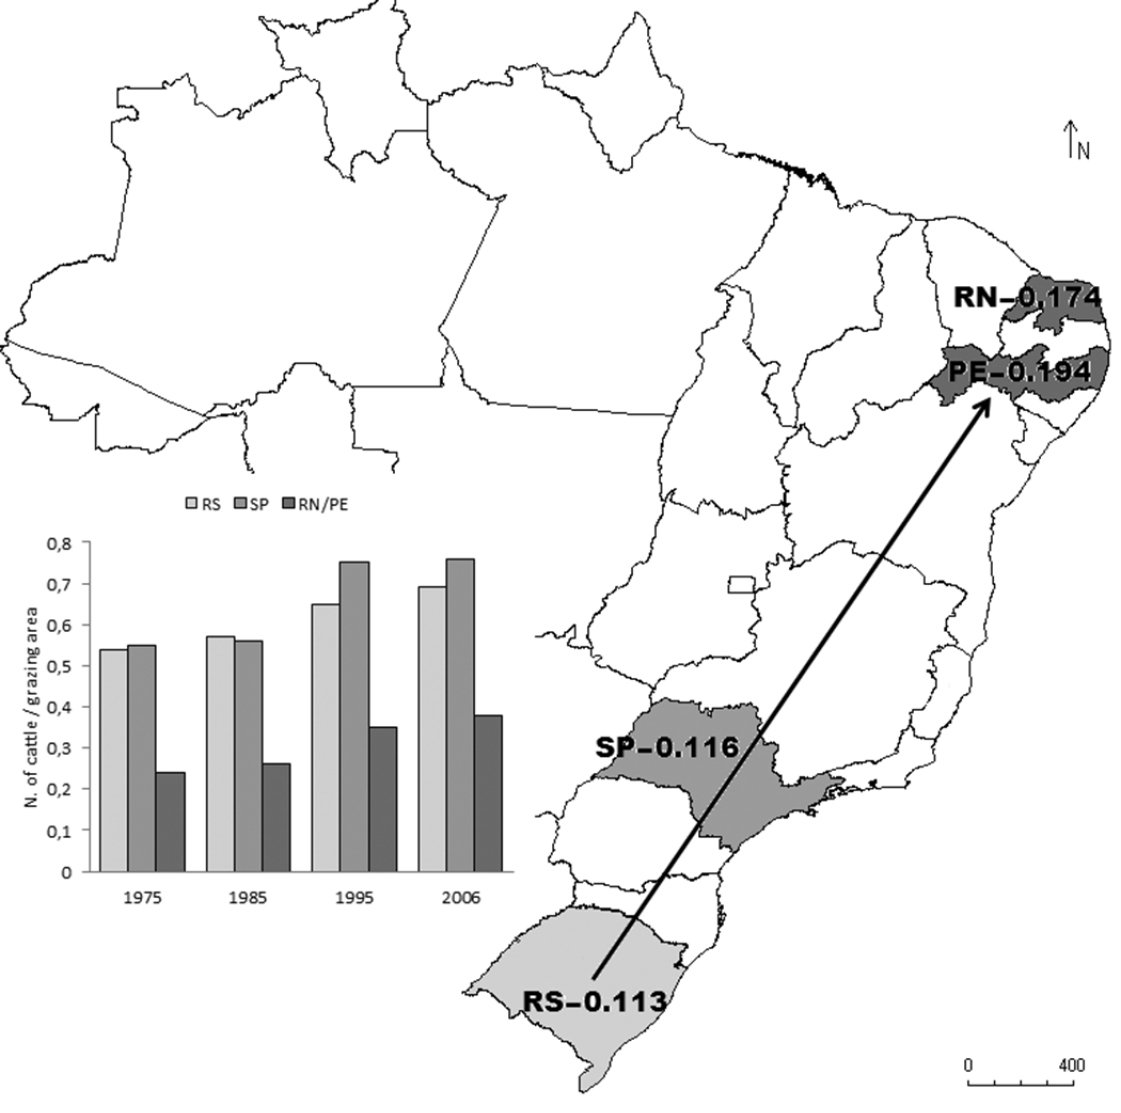
Map of Brazil showing states were cattle egret (Bubulcus ibis) populations were sampled. Levels of differentiation (Fst values) between each Brazilian population and the total African population are shown. Arrow indicates probable path of colonization. Histogram shows the number of cattle per grazing area in four periods (10 years apart) in the states sampled.

All private Brazilian haplotypes and some of the African haplotypes are located on branch tips in the haplotype network, which includes only three haplotypes shared by both continents (HAP-1, HAP-3 and HAP-7) (Fig. 2). HAP-1 is shared among all Brazilian populations and Ghana. HAP-3 is shared among all African populations and three Brazilian populations (RN, SP and RS). HAP-7 is shared among three Brazilian populations (RN, PE and RS) and Ghana.

Figure 2.

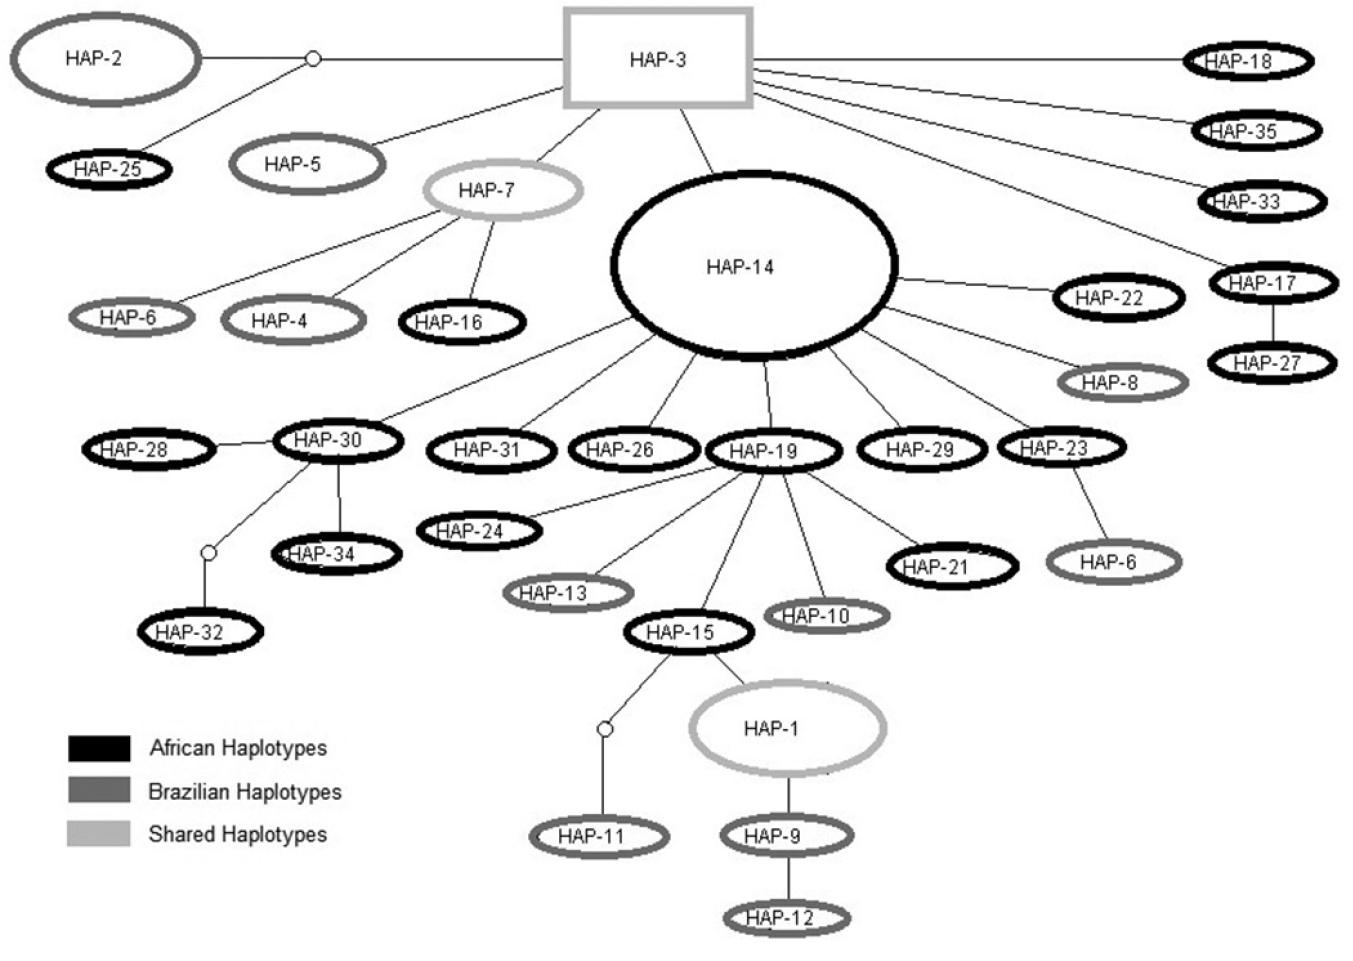
Haplotype network and relationships among 35 haplotypes of the domain I CR mtDNA region found in cattle egret (Bubulcus ibis) samples from Brazil and Africa. Areas of shapes are proportional to number of individuals sharing each haplotype.

Neutrality tests were performed assuming that the domain I sequence of the mtDNA is not under selection. Deviations from neutrality in these tests were considered to be indicative of demographic expansion (Table 2). Fu’s Fs and R2 tests revealed significant genetic signs of demographic expansion for the African population. The observed mismatch distribution curves displayed a unimodal shape for African and Brazilian populations and the SSD values were non-significant, indicating that the observed curves did not differ significantly from the population expansion model.

Table 2.

Results of neutrality tests performed for Brazilian and African populations of cattle egret (Bubulcus ibis).

Population Tajima’s D Fu and Li’s D* Fu and Li’s F* Fu’s Fs R2
Brazil 0.45 0.57 0.63 -1.50 0.10
Africa -1.28 -1.25 -1.50 -22.25# 0.10#

# significant values

Discussion

Understanding the colonization of the Americas by the cattle egret is a challenging task due to the lack of sufficient information and reports on entrance time, locality, number of events, and propagule pressure. Comparisons between native and non-native populations can provide a ‘natural’ experimental approach to clarify the biological and environmental factors that may contribute to range expansion and/or adaptation to climate change, and to reveal mechanisms by which organisms respond to novel ecological and environmental pressures (Schwartz et al. 2009, Neilson and Stepien 2011). The wide geographic distribution of the cattle egret requires exhaustive sampling of all occupied areas in the Americas for a complete study. However, since Brazil is located near the site of the first record of this species in South America and has huge dimensions, the present study involving Brazilian populations allows a first approach to this subject. For such, an analysis of domain I sequences was performed on mtDNA samples from both, Brazil and part of the native range in Africa, to determine the dispersal pattern of the cattle egret in Brazil. Previous studies on other organisms involving mtDNA data have been successful in providing evidence to support well-informed conclusions regarding invasion dynamics (Corin et al. 2007, Hoos et al. 2010, Rollins et al. 2011).

The present study is based solely on results from the analysis of mtDNA, which is maternally inherited, and included a limited sample from the African continent. This analysis revealed no decrease in the level of diversity in the Brazilian samples in relation to the African samples. Indeed, haplotype diversity (h) and molecular diversity (θs) were very similar between the African and Brazilian samples. According to Blackburn et al. (2009), there are more than 700 known non-native bird populations (representing more than 200 species) in non-native areas, but only 20 to 30 populations (representing seven species) have been surveyed for changes in genetic variability. The present results can be explained by multiple introductions or compared to reported cases in which no evident loss of variability was detected. For example, the saddleback (Philesturnus carunculatus carunculatus) has not exhibited a significant loss of variability after repeated population bottlenecks (Taylor and Jamieson 2008). According to Kekkonen et al. (2011), the house sparrow (Passer domesticus) has suffered a severe population decline in Finland over the last four decades, with no significant loss of genetic diversity. Since the details of initial colonization by the cattle egret are unknown and not all native areas were sampled, one can only affirm that the successful colonization of a non-native area occurred with no significant loss of genetic diversity through the evaluation of mtDNA.

The majority of mtDNA CR haplotypes were exclusive to either Brazil or Africa, with only three of the total 35 haplotypes shared between both areas. The admixture of Brazilian and African haplotypes could be due to retained ancestral polymorphism in these populations, which is expected for the recent colonization of a new area, such as in the case of the cattle egret in the Americas. The ancestral haplotype (HAP-3) was the fourth most frequent and it was found in both Brazil and Africa, as expected. The most common haplotypes in both the African and Brazilian populations were derived by one or two mutational steps from this ancestral haplotype. It therefore seems that, among the haplotypes sampled, HAP-3 was the first-established lineage, giving rise to other haplotypes, which increased in number with the expansion of the species. All Brazilian haplotypes are on branch tips in the haplotype network. This pattern does not mean that they emerged in the history of Brazilian populations due to the lack of sufficient time for the appearance of new mutations, but suggests that these haplotypes emerged more recently in the evolutive history of these sequences. African haplotypes on branch tips reveal that the African populations sampled are in a geographic range where expansion on the native continent also occurred. The detection of shared haplotypes (among all Brazilian samples and mostly Ghana) and the fact that the ancestral haplotype is present in both regions support a common origin for the African and Brazilian populations sampled.

Genetic differentiation between populations from Brazil and Africa was evidenced by statistically significant pairwise Fst values obtained for all paired comparisons in the two areas. Despite the fact that the African samples were not representative of all regions of the continent, the supposition was that the least differentiated population sampled in the non-native area in relation to the African samples would be more similar to the founder population. The results of the mtDNA analysis of genetic differentiation indicated that Brazil was first colonized in the southern region (RS population) (Figure 1). The first record of a breeding colony of cattle egrets in Brazil was on Marajó Island in the northern region of the country (Sick 1965), which was followed by several reports of the occurrence of the species in the southern region during the 1970s and a breeding colony in this same region in 1980 (Belton 1974). According to the supposition put forth here, although the species had arrived to the country through the north, it did not begin its expansion in this region of the country because the Brazilian landscape is not uniform. The cattle egret is capable of long-distance dispersal across unsuitable habitats and the amount of suitable habitats available in southern Brazil may have been the most important factor to determining its dispersal pattern. Thus, the reason for this order of occupation of non-native areas is the landscape similarity between native areas in Africa and non-native areas found in southern Brazil. Hayes and Barry (2008) showed that climate/habitat match and number of introduced organisms are consistently significant predictors of successful establishment across all of the biological groups in which they have been tested (birds, mammals and plants). The initial occupation of the state of Rio Grande do Sul (southern Brazil) is justified by the similarity between this region and the native African range of the cattle egret. As the cattle egret forages in close association with grazing animals, the large amount of cattle breeding activities and the presence of extensive areas of natural grasslands may also have influenced the establishment of this species in this state. Indeed, at the time of the establishment of the cattle egret in the southern region of Brazil, the states of Rio Grande do Sul and São Paulo (located in the southern and southeastern regions, respectively) had a higher number of cattle per grazing area (Fig. 1) (census data; IBGE 1975). Alternatively, one may suppose that entrance to the country also occurred in southern Brazil, which can be justified by the records of occurrence (Belton 1974). After the occupation of this state, the species may have expanded its range in a northeasterly direction, occupying the southeastern and then northeastern regions of Brazil, where cattle numbers and the availability of pastures have grown over the past 40 years (Fig. 1).

All pairwise Fst values between the Brazilian and African populations were statistically significant, as can be seen in Figure 1. This suggests a certain degree of constraint in gene flow. On the other hand, the partial admixture of Brazilian and African haplotypes detected in the haplotype network can be interpreted as a sign of gene flow between these two areas. The possibility of continuing migration to South America from different (non-sampled) regions of Africa cannot be ruled out, since a limited sample from Africa was included in this study. Valverde (2003) report a cattle egret banded in Spain and recovered in Central America in 1956, presumably following the proposed wind route that runs from southern Europe to the northern portion of South America. Cattle egrets have been also recorded on different South Atlantic islands, such as the St. Peter and St. Paul archipelago, Ascension, St. Helena and Tristan de Cunha (Telfair 1983). These facts and similar genetic diversity levels found in these two areas support continuous migration events from Africa to America favored by wind routes.

The present findings revealed no signs of demographic expansion in Brazil, as expected for a recent colonization process. However, Fs and R2 values and the unimodal mismatch curves revealed significant genetic signs of demographic expansion in the African samples. According to Ramos-Onsins and Rozas (2002), R 2 and Fu’s Fs are the most powerful statistics for the detection of demographic expansion, while Tajima’s D and Fu and Li’s F* and D* have comparatively less power. Recent demographic expansion in Africa has been documented in the literature (Chapin 1932, Browder 1973, Telfair 1983). The cattle egret was originally restricted to tropical and subtropical regions of the African continent (Crosby 1972, Brown et al. 1982), but expanded to other regions. Between 1920 and 1930, cattle egret occurred without reproduction in the most of the Atlantic coast areas (including Ghana and Nigeria, which were sampled in the present study) and in the coastal portion part of central Africa, which was interpreted to mean that populations were temporarily occupying these areas. Currently, the species occurs and breeds throughout nearly the entire continent, except in the Sahara and Namib deserts (Browder 1973).

Conclusions

The cattle egret has retained most of the mtDNA genetic diversity during the colonization process in Brazil. Genetic signs of demographic expansion were detected in the African sample. The genetic differentiation analysis shows that this species began colonization in the southern region of the country and expanded in a northeasterly direction to the southeastern and northeastern regions. This dispersal pattern is supported by the environmental characteristics and larger amount of cattle raising and pasture areas in the south region in comparison to the two other regions sampled. Future studies involving a greater number of samples in its native range and the inclusion of an analysis of nuclear genes will provide a more complete scenario of the proposed colonization process of the cattle egret in Brazil.

Acknowledgments

We acknowledge the comments and suggestions made by the reviewers, which greatly contributed to improving the quality of this manuscript. EMS acknowledges support from the Conselho Nacional de Desenvolvimento Científico e Tecnológico (CNPq-Brazil, 870195/1997-2) for a Ph.D grant. SNDL received funds from the Fundação de Amparo à Pesquisa do Estado de São Paulo (FAPESP-Brazil, 2010/50406-5). The permit for the collection of samples was provided by the Instituto Chico Mendes de Conservação da Biodiversidade (ICMBio- Number 20295-2) and the Instituto Brasileiro do Meio Ambiente e dos Recursos Naturais (IBAMA). Permits for the importation of samples were provided by the Instituto Brasileiro do Meio Ambiente (IBAMA– Number 11BR007199/DF, 11BR007010/DF). The authors are grateful to Roberta Rodrigues from CEMAVE, Jacinta Abalaka and Dr. Shiiwa Manu from A. P. Leventis Ornithological Research Institute (APLORI), Daryl Bosu from NGO A Rocha Ghana for collecting samples, Mr. Scherezino Scherer (IBAMA) for helping with the field expedition in RS and Carlos Congrains Castillo for help with data analysis.

References
Akaike H (1974) A new look at the statistical model identification. IEEE Transactions on Automatic Control 19: 716-723. doi: 10.1109/TAC.1974.1100705
Allendorf FW, Lundquist LL (2003) Introduction: population biology, evolution, and control of invasive species. Conservation Biology 17: 24-30. doi: 10.1046/j.1523-1739.2003.02365.x
Barbosa-Filho RC, de Sousa AEAB, Freitas GL, Nunes MFC, de Souza EA, Zeppelini-Filho D (2009) A garça-vaqueira (Bubulcus ibis Linnaeus, 1758) e o atobá-de-pé-vermelho (Sula sula Linnaeus, 1766) no Arquipélago de Fernando de Noronha: uma abordagem ecológica comparativa. Ornithologia 3: 101-114.
Belton W (1974) Cattle egrets in Rio Grande do Sul, Brazil. Bird Banding 45: 59. doi: 10.2307/4512002
Beneteau CL, Walter RP, Mandrak NE, Heath DD (2012) Range expansion by invasion: genetic characterization of invasion of the greenside darter (Etheostoma blennioides) at the northern edge of its distribution. Biological Invasions 14: 191-201. doi: 10.1007/s10530-011-9996-8
Blackburn TM, Lockwood JL, Cassey P (2009) Avian invasions: the ecology and evolution of exotic birds. Oxford University Press, Oxford, 1–304. doi: 10.1093/acprof:oso/9780199232543.003.0001
Browder JA (1973) Long-distance movements of cattle egrets. Bird Banding 44: 158-170. doi: 10.2307/4511956
Brown LH, Urban EK, Newman K (1982) The birds of Africa Volume I. Academic Press, Princeton, 1–521.
Chapin JP (1932) The birds of the Belgian Congo. Bulletin of the American Museum of Natural History 65: Part 1.
Clement M, Posada D, Crandall KA (2000) TCS: a computer program to estimate gene genealogies. Molecular Ecology 9: 1657-1659. doi: 10.1046/j.1365-294x.2000.01020.x
Colautti RI, Grigorovich IA, MacIsaac HJ (2006) Propagule pressure: a null model for biological invasions. Biological Invasions 8: 1023-1037. doi: 10.1007/s10530-005-3735-y
Corin SE, Lester PJ, Abbott KL, Ritchie PA (2007) Inferring historical introduction pathways with mitochondrial DNA: the case of introduced argentine ants (Linepithema humile) into New Zealand. Diversity and Distributions 13: 510-518. doi: 10.1111/j.1472-4642.2007.00355.x
Crandall KA, Templeton AR (1993) Empirical tests of some predictions from coalescent theory with applications to intraspecific phylogeny reconstruction. Genetics 134: 959-969.
Crosby GT (1972) Spread of the cattle egret in the Western Hemisphere. Bird Banding 43: 205–212. doi: 10.2307/4511880
Excoffier L, Lischer HEL (2010) Arlequin suite ver 3.5: A new series of programs to perform population genetics analyses under Linux and Windows. Molecular Ecology Resources 10: 564–567. doi: 10.1111/j.1755-0998.2010.02847.x
Fu YX (1997) Statistical tests of neutrality against populations growth?, hitchhiking and background selection. Genetics 133: 693-709.
Fu YX, Li WH (1993) Statistical tests of neutrality of mutations. Genetics 133: 693-709.
Hall TA (1999) Bioedit: a user-friendly biological sequence alignment editor and analysis program for Windows 95–98-NT. Nucleic Acids Symposium Series 41: 95-98.
Hawley DM, Hanley D, Dhondt AA, Lovette IJ (2006) Molecular evidence for a founder effect in invasive house finch (Carpodacus mexicanus) populations experiencing an emergent disease epidemic. Molecular Ecology 15: 263-275. doi: 10.1111/j.1365-294X.2005.02767.x
Hayes KR, Barry SC (2008) Are there any consistent predictors of invasion success? Biological Invasions 10: 483–506. doi: 10.1007/s10530-007-9146-5
Hogan FE, Cooke R, Burridge CP, Norman JA (2008) Optimizing the use of shed feathers for genetic analysis. Molecular Ecology Resources, 561–567.
Hoos PM, Miller AH, Ruiz GM, Vrijenhoek RC, Geller JB (2010) Genetic and historical evidence disagree on likely sources of the Atlantic amethyst gem clam Gemma gemma (Totten, 1834) in California. Diversity and Distributions 16: 582-592. doi: 10.1111/j.1472-4642.2010.00672.x
IBGE (1975) Brazilian Institute of Geography and Statistics. www.ibge.gov.br
Kekkonen J, Hanski IK, Jensen H, Vaisanen RA, Brommer JE (2011) Increased genetic differentiation in house sparrows after a strong population decline: from panmixia towards structure in a common bird. Biological Conservation 144: 2931-2940. doi: 10.1016/j.biocon.2011.08.012
Kolbe JJ, Glor RE, Schettino LR, Lara AC, Larson A, Losos JB (2004) Genetic variation increases during biological invasion by a Cuban lizard. Nature 431: 177-181. doi: 10.1038/nature02807
Larkin MA, Blackshields G, Brown NP, Chenna R, McGettigan PA, McWilliam H, Valentin F, Wallace IM, Wilm A, Lopez R, Thompson JD, Gibson TJ, Higgins DG (2007) Clustal W and Clustal X version 2.0. Bioinformatics 23: 2947-2948. doi: 10.1093/bioinformatics/btm404
Librado P, Rozas J (2009) DnaSP v5: a software for comprehensive analysis of DNA polymorphism data. Bioinformatics 25: 1451-1452. doi: 10.1093/bioinformatics/btp187
Lockwood JL, Cassey P, Blackburn T (2005) The role of propagule pressure in explaining species invasions. Trends in Ecology & Evolution 20: 223-228. doi: 10.1016/j.tree.2005.02.004
Miño CI, Del Lama SN (2009) Molted feathers as a source of DNA for genetic studies in waterbird populations. Waterbirds 32: 322-329. doi: 10.1675/063.032.0212
MMA: Maps of Brazilian Biomes vegetation coverage. www.mma.gov.br/portalbio
Neilson ME, Stepien CA (2011) Historic speciation and recent colonization of eurasian monkey gobies (Neogobius fluviatilis and N. pallasi) revealed by DNA sequences, microsatellites, and morphology. Diversity and Distributions 17: 688-702. doi: 10.1111/j.1472-4642.2011.00762.x
Palmer RS (1962) Handbook of North American Birds Vol I: Loons through Flamingos. Yale University Press, New Haven, 1–567.
Phillips RB, Wiedenfeld DA, Snell HL (2012) Current status of alien vertebrates in the Galapagos Islands: invasion history, distribution, and potential impacts. Biological Invasion 14: 461–480. doi: 10.1007/s10530-011-0090-z
Posada D (2008) jModelTest: phylogenetic model averaging. Molecular Biology and Evolution 25: 1253-1256. doi: 10.1093/molbev/msn083
Ramos-Onsins SE, Rozas J (2002) Statistical properties of new neutrality test against population growth. Molecular Biology and Evolution 19: 2092-2100. doi: 10.1093/oxfordjournals.molbev.a004034
Rogers AR, Harpending H (1992) Population growth makes waves in the distribution of pairwise genetic differences. Molecular Biology and Evolution 9: 552-569.
Rollins LA, Woolnough AP, Sinclair R, Mooney NJ, Sherwin WB (2011) Mitochondrial DNA offers unique insights into invasion history of the common starling. Molecular Ecology 20: 2307–2317. doi: 10.1111/j.1365-294X.2011.05101.x
Sambrook J, Russell DW (2001) Molecular cloning, a laboratory manual. Cold Spring Harbor Laboratory Press, Nova York, 1–1448.
Schwartz A, Strubbe D, Butler CJ, Matthysen E, Kark S (2009) The effect of enemy-release and climate conditions on invasive birds: a regional test using the rose-ringed parakeet (Psittacula krameri) as a case study. Diversity and Distributions 15: 310-318. doi: 10.1111/j.1472-4642.2008.00538.x
Schwarz G (1978) Estimating the dimension of a model. Annals of Statistics 6: 461-464. doi: 10.1214/aos/1176344136
Sick H (1965) Bubulcus ibis (L.) na Ilha de Marajó, Pará: garça ainda não registrada no Brasil. Anais da Academia Brasileira de Ciências 37: 567-570.
Siegfried WR (1965) The status of the cattle egret in the Cape Province. Ostrich 36: 109-116. doi: 10.1080/00306525.1965.9633870
Silva-Jr JM, Péres-Jr AK, Sazima I (2004) Euprepis atlantis (Noronha skink) predation. Herpetological Review 36: 62-63.
Skead CJ (1952) The status of the cattle egret in the eastern Cape Province. Ostrich 23: 186-218. doi: 10.1080/00306525.1952.9633798
Skellam JG (1951) Random dispersal in theoretical populations. Biometrika 38: 196-218.
Stone CP, Anderson SJ (1988) Introduced animals in Hawaii’s natural areas. In: Crabb AC, Marsh RE (Eds) Proceedings of the thirteenth vertebrate pest conference, Monterey (USA), March 1988. University of California Press, USA, 134-140
Tajima F (1989) Statistical method for testing the neutral mutation hypothesis by DNA polymorphism. Genetics 123: 585-595.
Tajima F (1996) Infinite-allele model and infinite-site model in population genetics. Journal of Genetics 75: 27-31. doi: 10.1007/BF02931749
Taylor SS, Jamieson IG (2008) No evidence for loss of genetic variation following sequential translocations in extant populations of a genetically depauperate species. Molecular Ecology 17: 545-556.
Telfair RC II (1983) The cattle egret: a Texas focus and world view. The Texas Agricultural Experimentation Station, Texas A&M University, College Station, Texas, 1–144.
Valverde JA (2003) Memorias de un biologo heterodoxo. Volume 1. Quercus Ed., 200–201.
Yonekura R, Kawamura K, Uchii K (2007) A peculiar relationship between genetic diversity and adaptability in invasive exotic species: bluegill sunfish as a model species. Ecological Research 22: 911-919. doi: 10.1007/s11284-007-0357-0
Wetmore A (1963) An early record of the cattle egret in Colombia. Auk 80: 547. doi: 10.2307/4082863
Appendix
Table S1.

Number of samples and locations in Brazil and Africa.

Location name Number of samples Geographic coordinates
BRAZIL Pernambuco state - PE 13 8°52'S, 36°28'W
Rio Grande do Norte state - RN 12 5°37'S, 36°52'W
São Paulo state - SP 13 22°30'S, 47°35'W
Rio Grande do Sul state – RS 13 30°01'S, 51°31'W
AFRICA Nigeria 11 9°58'N, 8°53'E
Kenya 20 1°19'S, 36°51'E
Kakun National Park - Ghana 15 05°32' N, 01°13W
Korle Lagoon, Accra city - Ghana 15 09°05'N, 01°49W