|
||
|
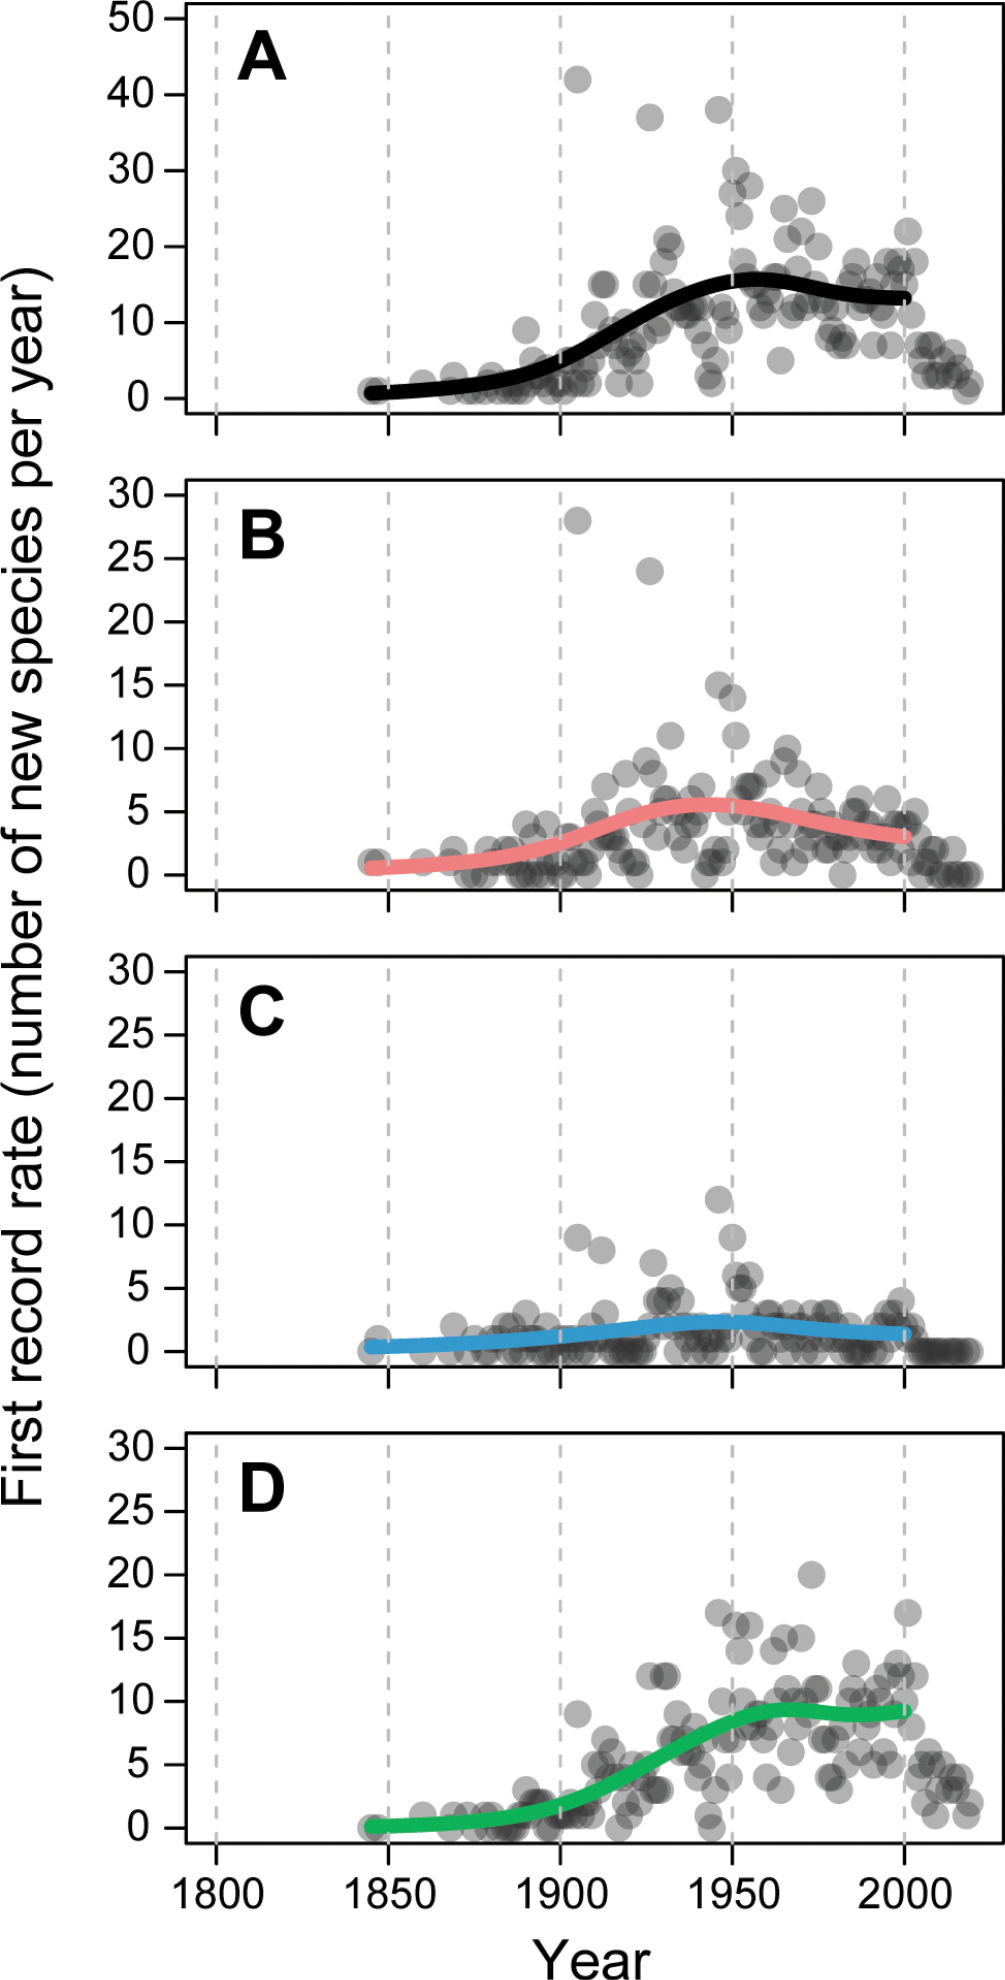
Temporal trends in first record rates in Japan, 1845–2000 A overall trends without distinguishing pathways B–D trends for intentional, unintentional and unknown introductions, respectively. Grey dots indicate the observed numbers of first recorded species, and lines indicate the generalised additive model (GAM) estimations (for the model fitting results, see Suppl. material 3). Note that the observed numbers of the first recorded species after 2000 are shown for reference purposes but were not included in the GAM analysis. |