|
||
|
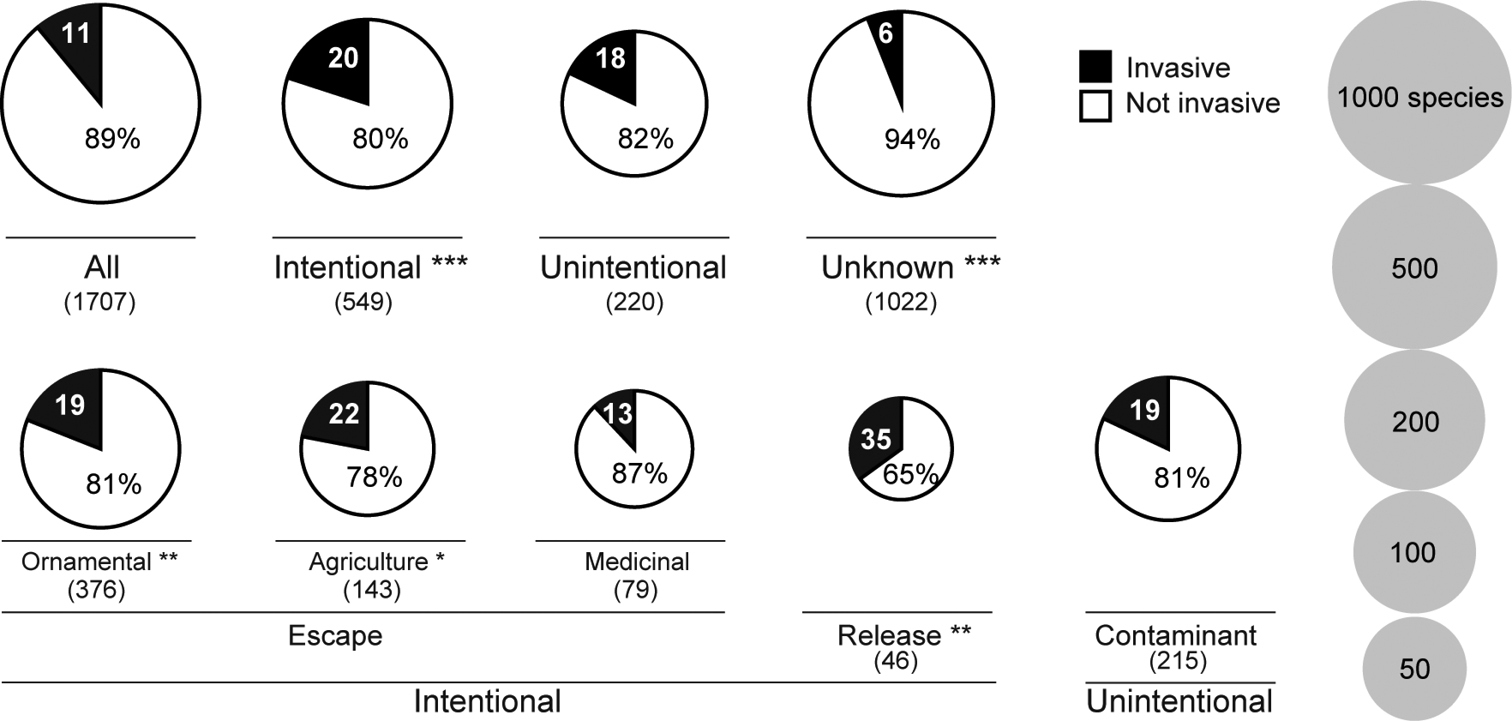
Proportion of invasive species by pathway with more than 40 species involved. Asterisks indicate significant differences in the proportion of invasive species compared to the overall pattern (All) without distinguishing pathways (Fisher’s exact test with Bonferroni correction of p values: * p < 0.05, ** p < 0.01, *** p < 0.001). The numbers in brackets and size of the pie charts show the total number of species involved in the pathways. As one species may be included in multiple pathways, the number for each subcategory amounts to more than the overall number (All). |