|
||
|
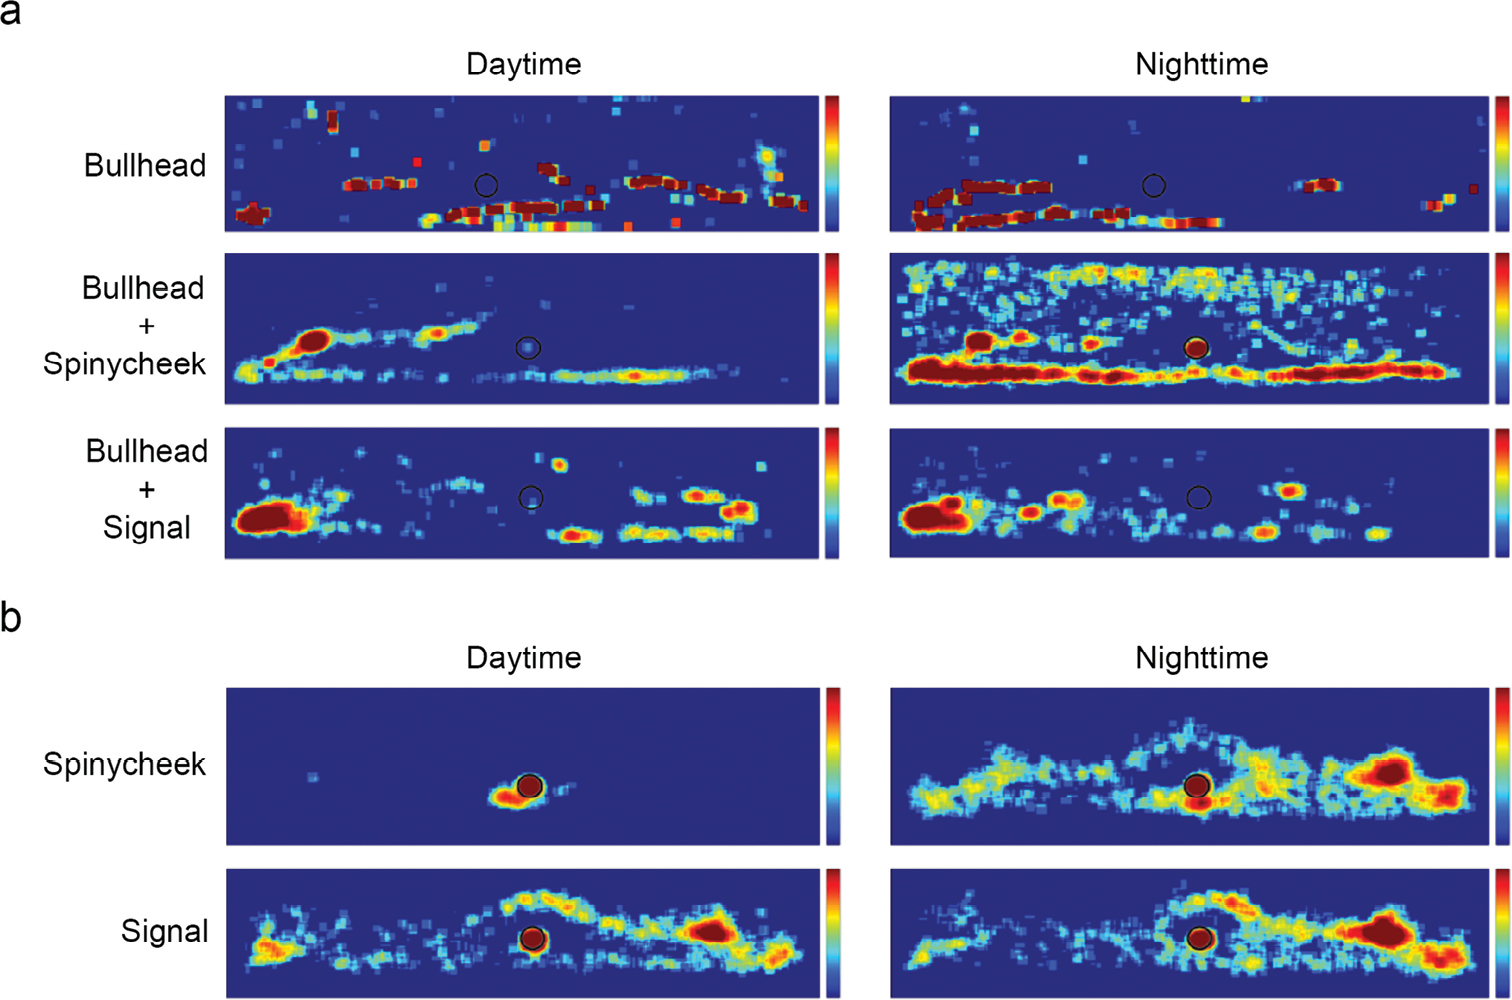
Heatmaps (shifting from blue over yellow to red with the increase of time spent in this respective location) is a graphical representation of the shelter occupation and animal distribution in the experimental tank a heatmaps showing the movement of bullhead, (Cottus gobio) in the absence or presence of invasive crayfish species (spinycheek, Faxonius limosus or signal crayfish, Pacifastacus leniusculus) during day and night b heatmaps illustrate the localization and dynamics of spinycheek and signal crayfish inside the aquarium during day and night. |