|
||
|
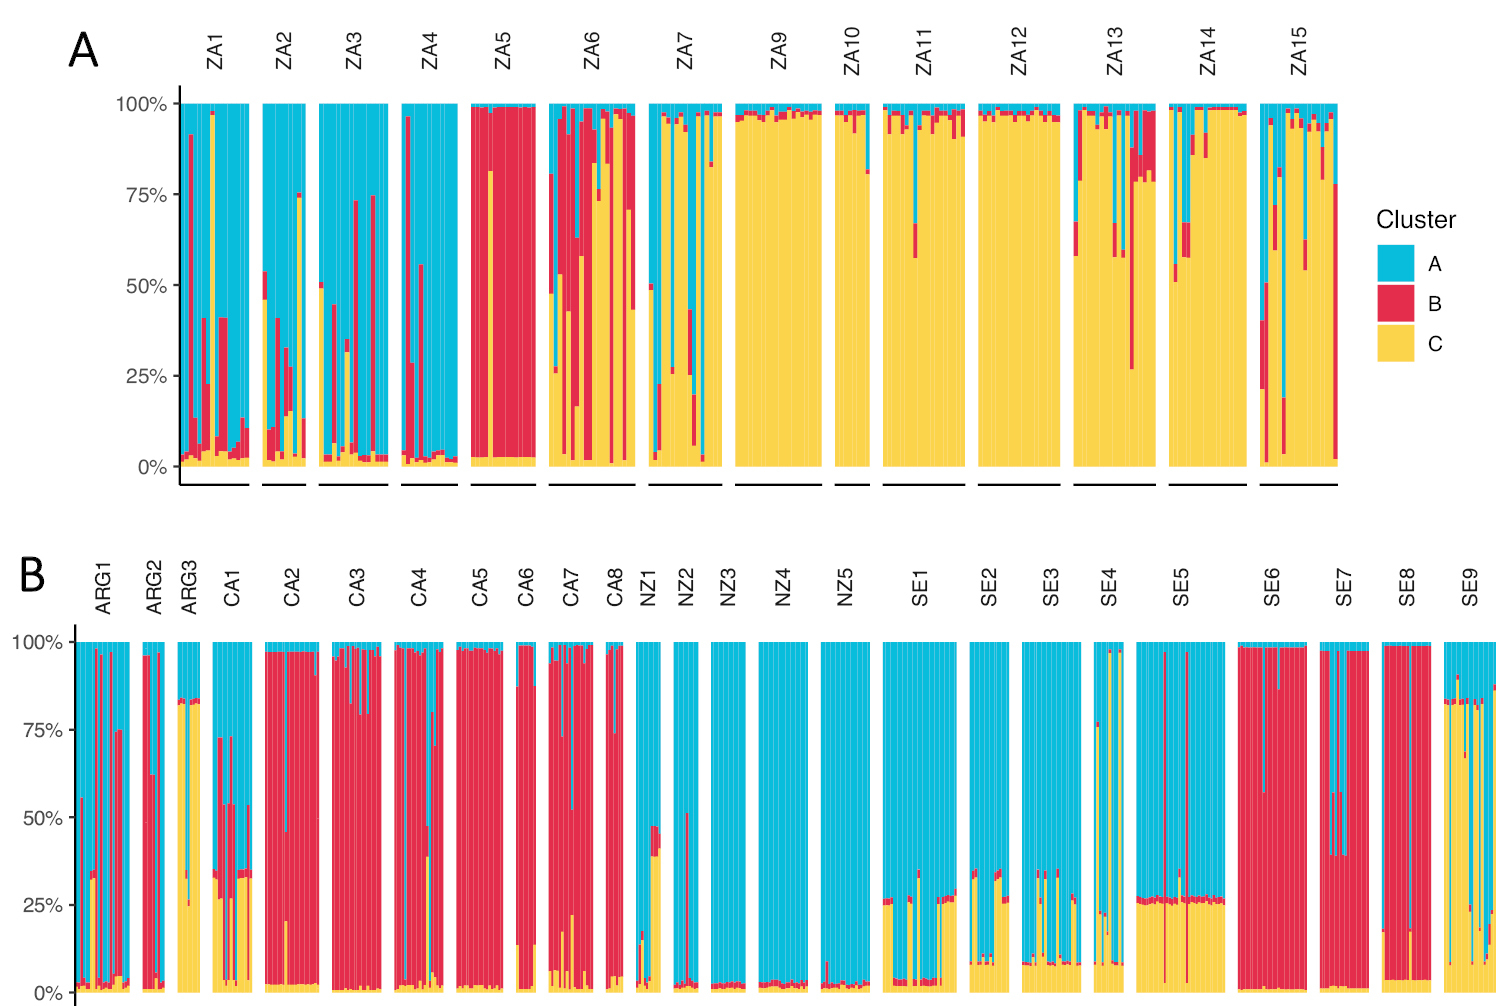
Bar plots showing the genetic structure of the A native South African and B non-South African populations of Carpobrotus species included in this study. Note that both plots represent the same analysis and were split into two panes for better visualization. The delta K method following Evanno et al. (2005) revealed K = 3 as the optimal number of genetic clusters. Abbreviations above the bar plots indicate the ID of the populations (see Table 1 for more details). |