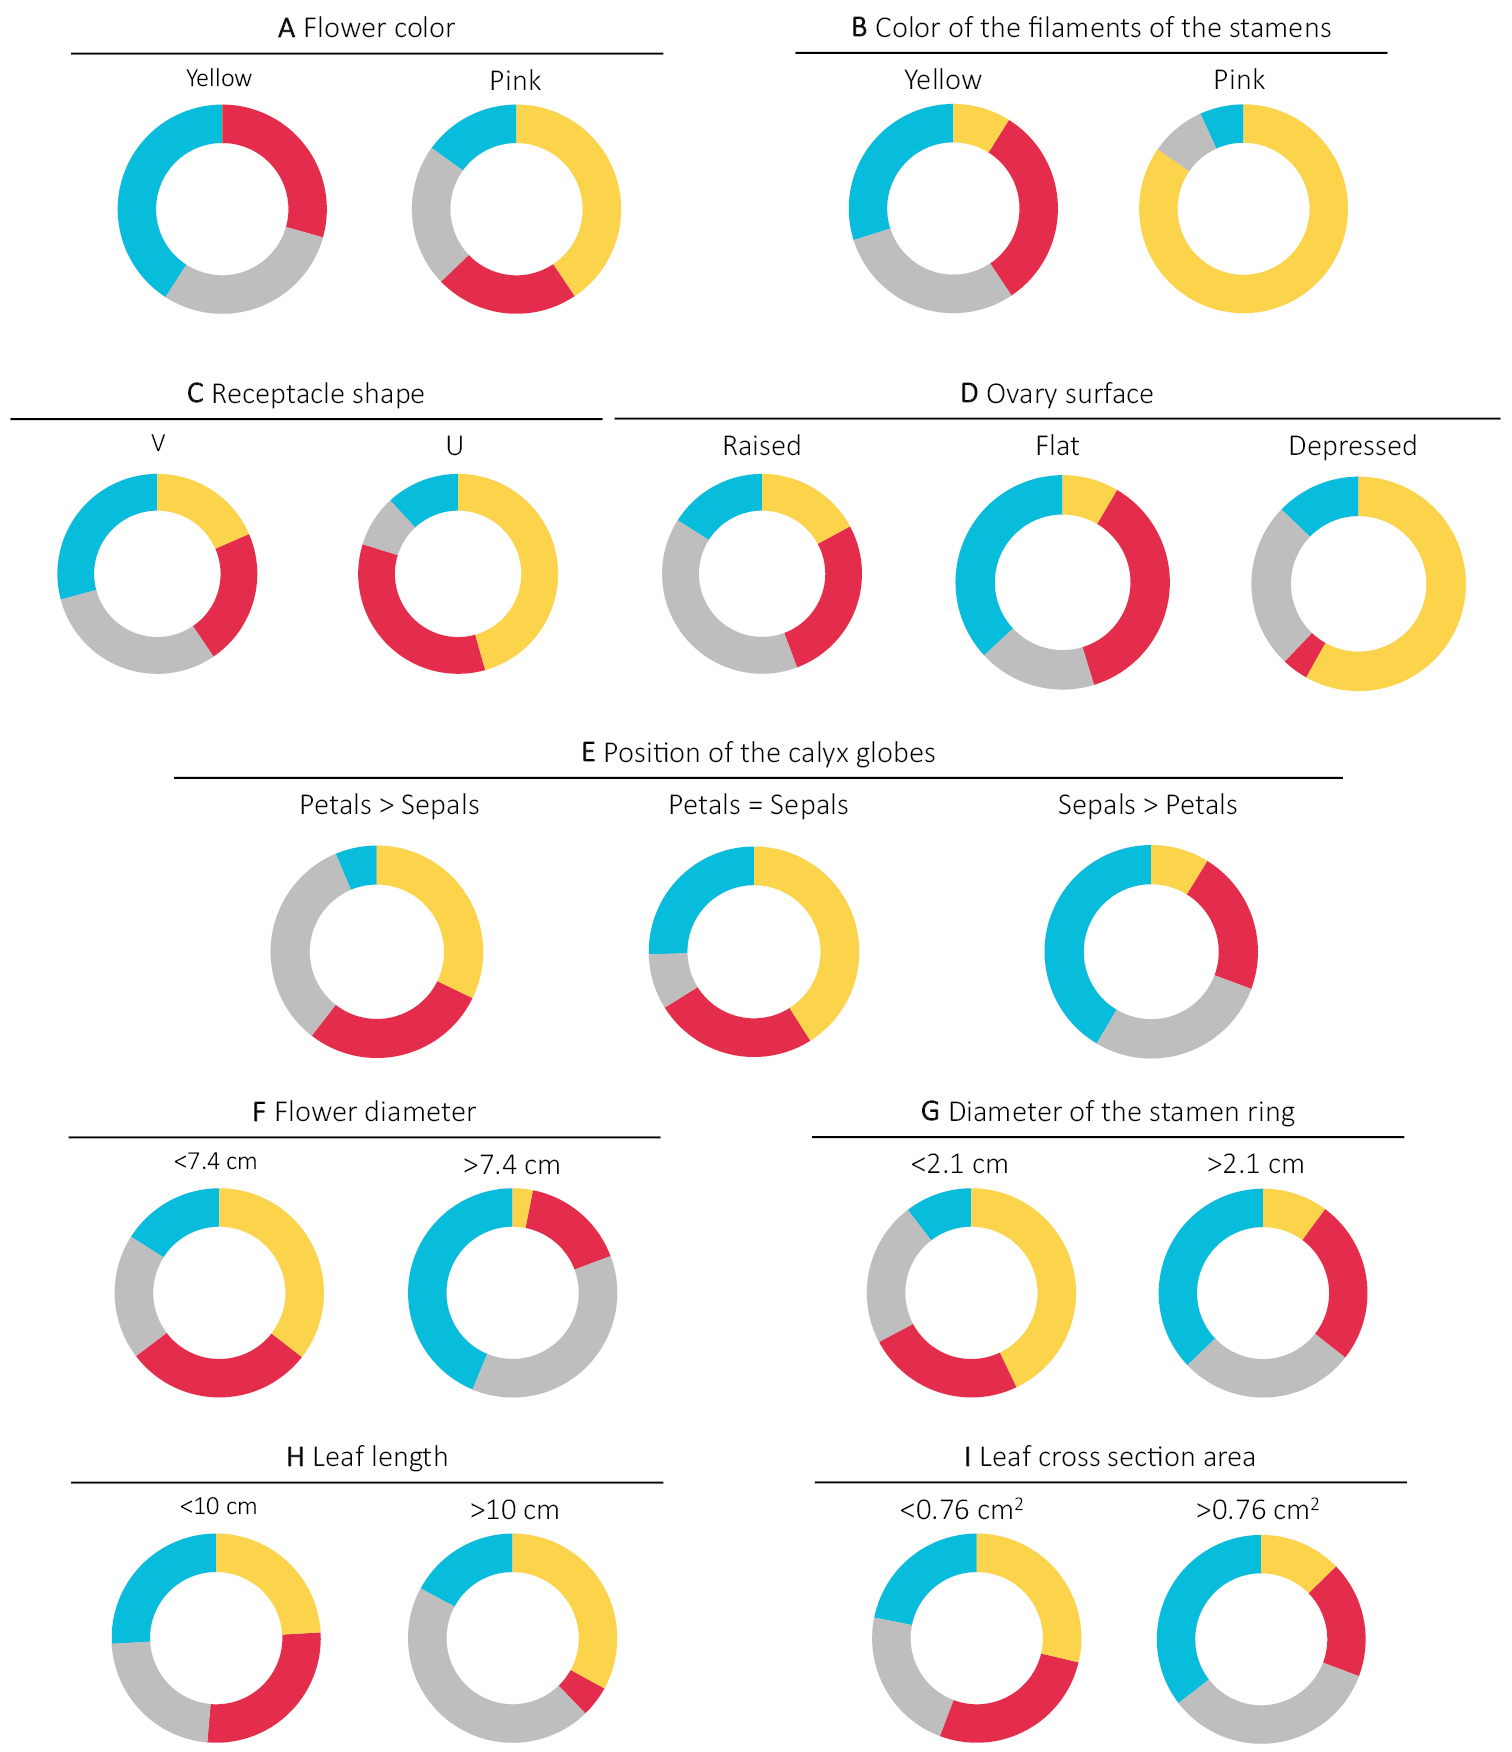
Donut plots representing the proportion of Carpobrotus individuals belonging to different genetic clusters, or admixtures between them, and morphological characteristics (see Fig. 2 for details). Blue = cluster A; red = cluster B; yellow = cluster C; grey = admixed.


  Part of: Novoa A, Hirsch H, Castillo ML, Canavan S, González L, Richardson DM, Pyšek P, Rodríguez J, Borges Silva L, Brundu G, D’Antonio CM, Gutiérrez JL, Mathese M, Levin S, Silva L, Le Roux JJ (2023) Genetic and morphological insights into the Carpobrotus hybrid complex around the world. NeoBiota 89: 135-160. https://doi.org/10.3897/neobiota.89.109164