|
||
|
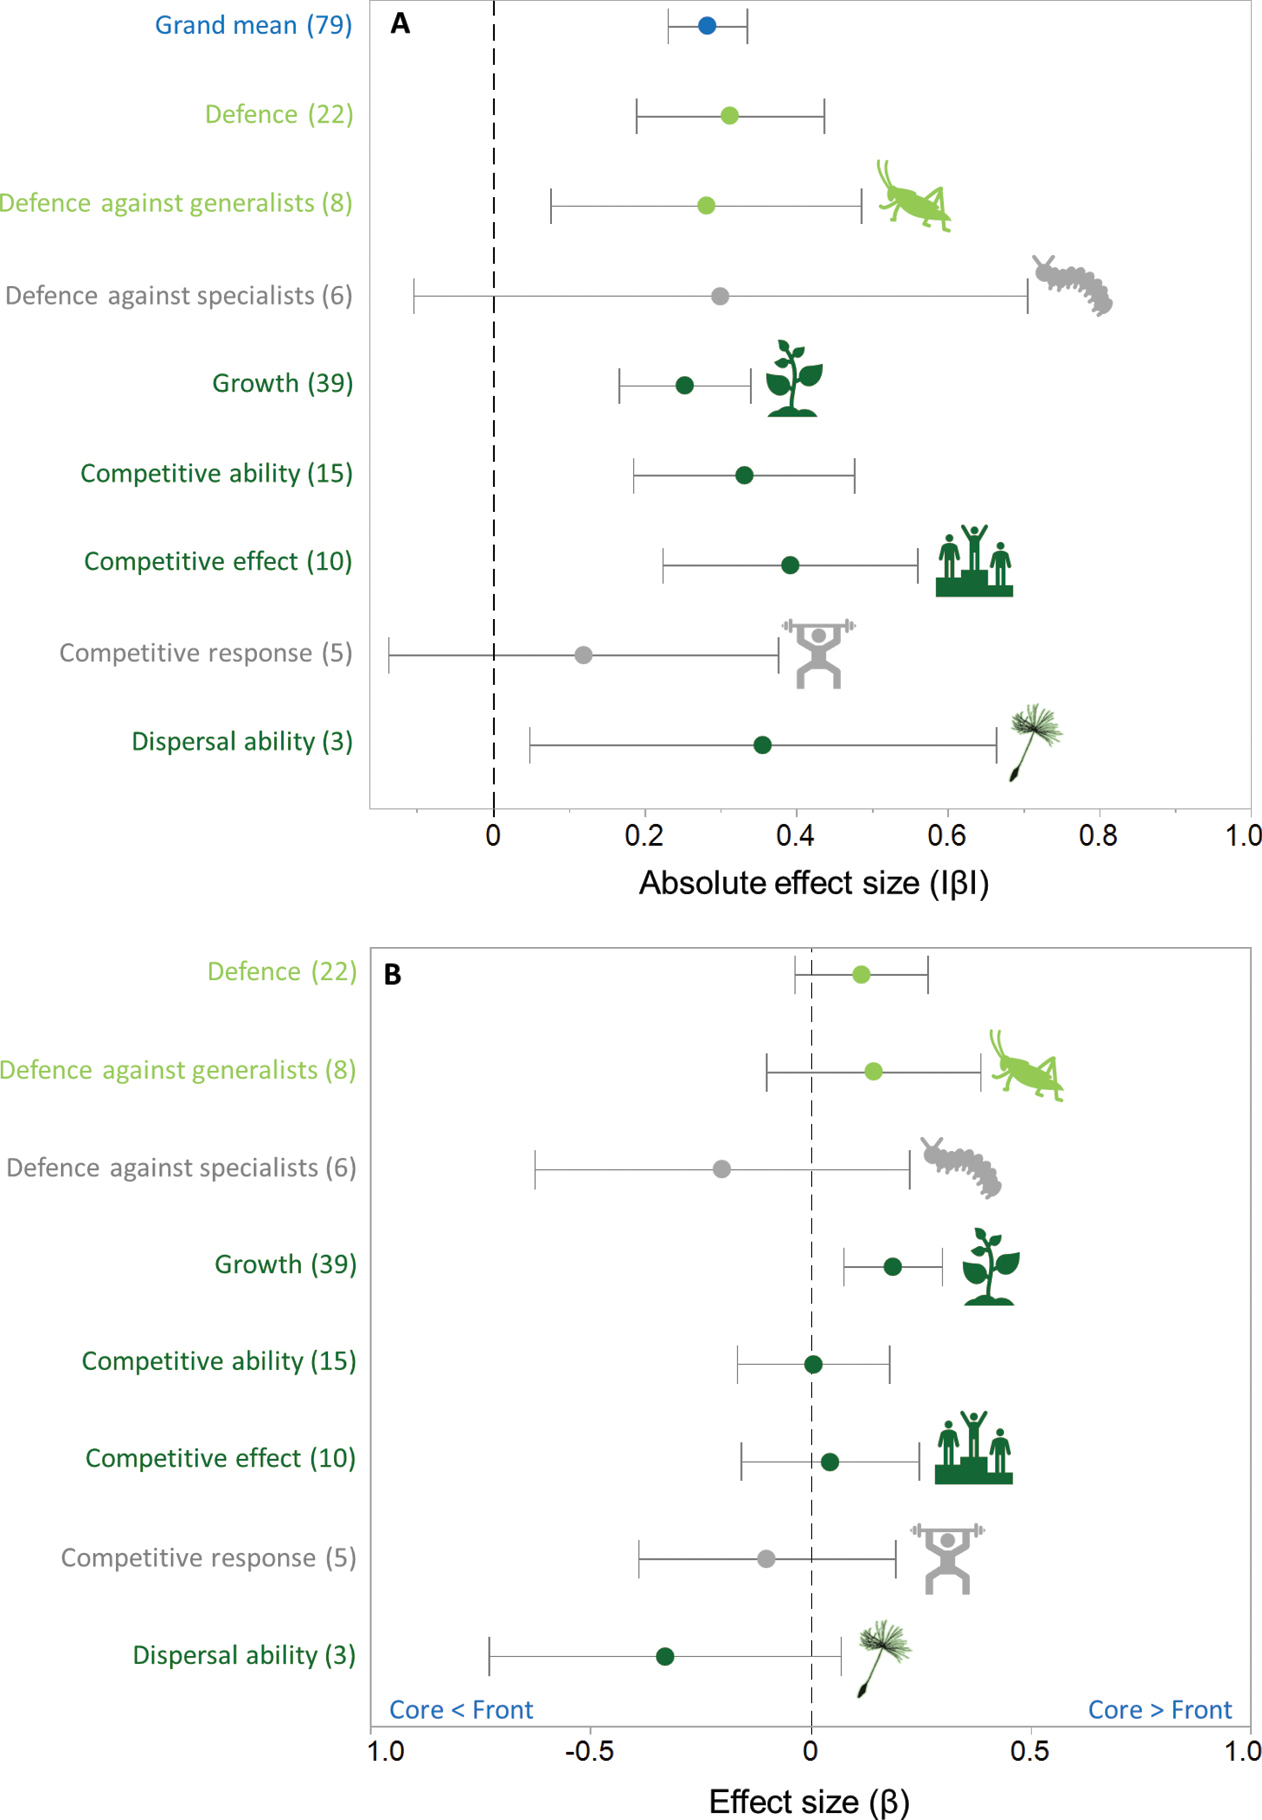
Meta-analysis results showing A mean absolute effect sizes (|β| ± 95% confidence intervals; 0 ≤ |β| ≤ 1) of differences along invasion history gradients for the grand mean for all categories (blue) and each trait category separately and B mean effect sizes (β ± 95% confidence intervals; -1 ≤ β ≤ 1) of differences along invasion history gradients for each trait category. Mean effect sizes are significantly different from zeroes if the confidence intervals do not include zero values, indicating significant trait changes. Negative effect sizes in B indicate a negative slope of decreased trait values away from core populations, while positive values indicate an increase towards core populations. Trait categories in light green, dark green and grey, indicate predicted postive, negative or no effect, respectively (see Fig. 1). Sample sizes (number of cases) are indicated in parentheses. |