|
||
|
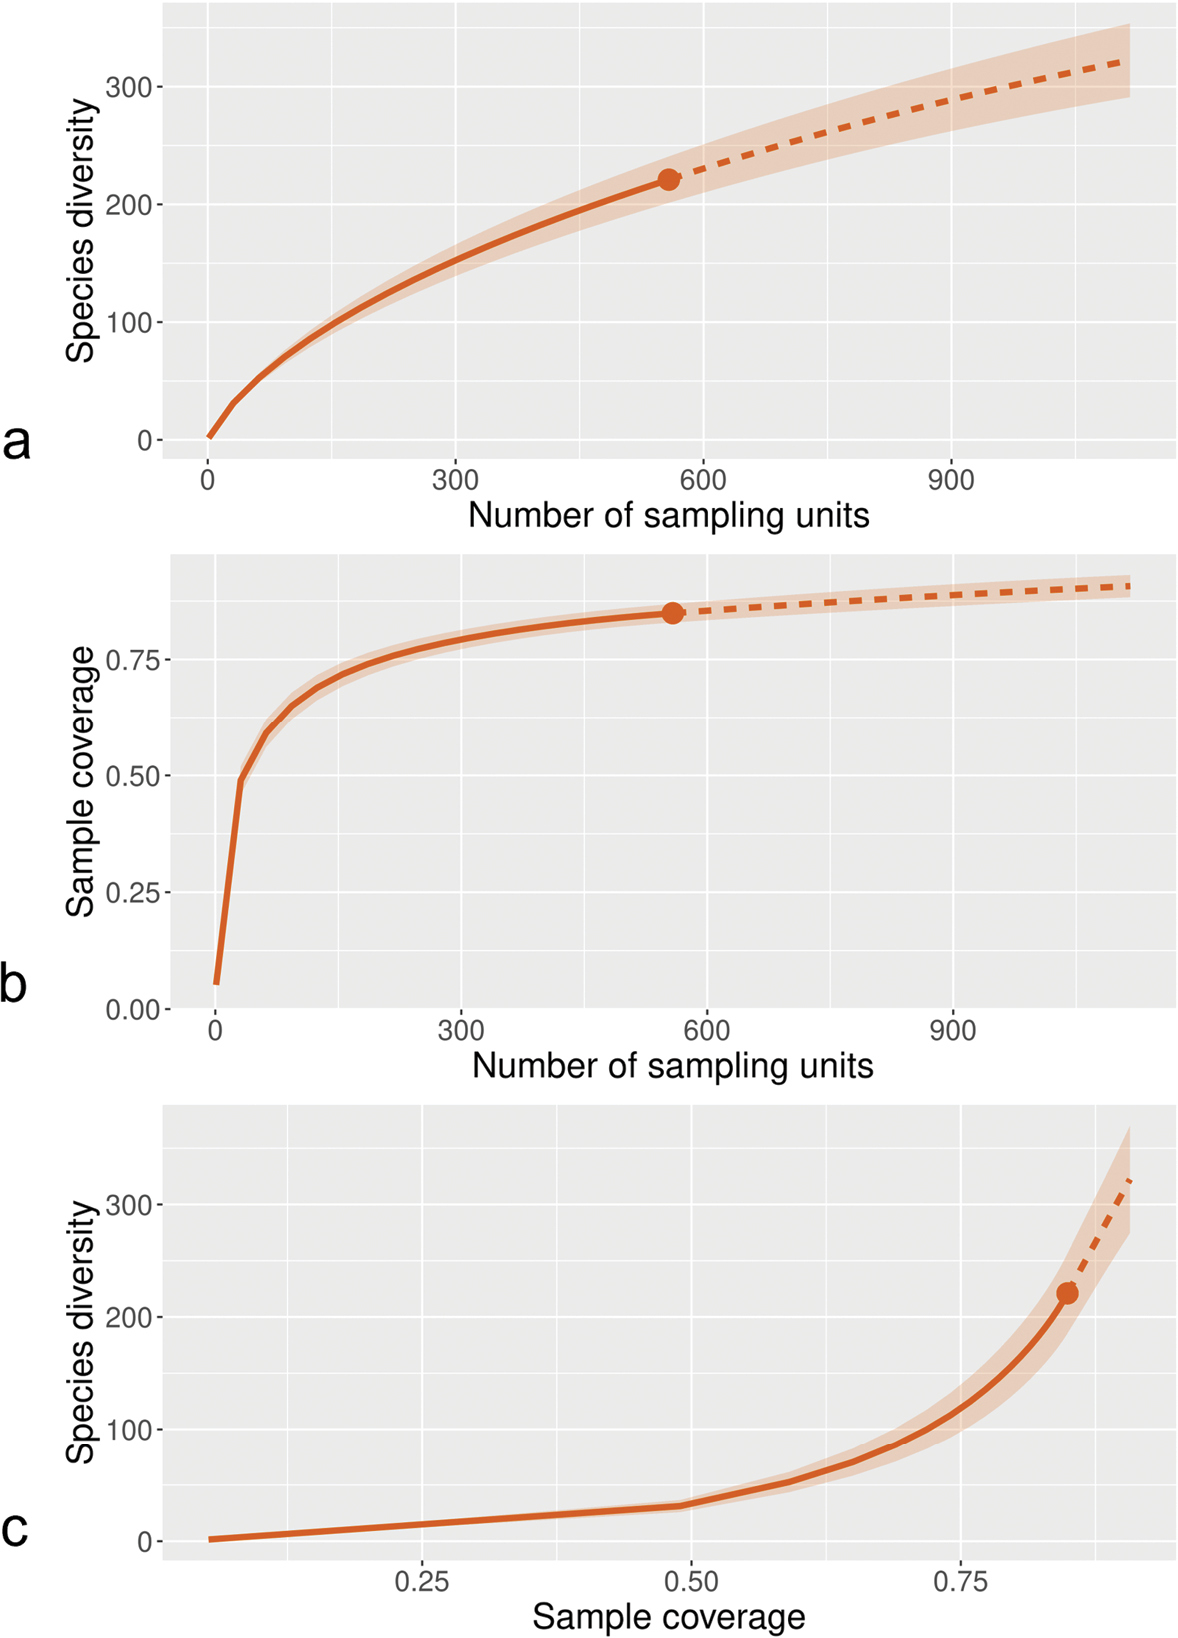
Rarefaction (solid lines) and extrapolation (dashed lines) curves for species richness of potentially invasive plants based on incidence data from gardens. Panel a species accumulation curve (species richness with increasing sample number). Panel b sample completeness curve (sample coverage with increasing sample number). Panel c coverage-based sampling curve (species richness with increasing sample coverage). Shaded areas = 95% confidence intervals (based on 100 bootstrap replications). Number of sampling units = number of gardens. Sample coverage = proportion of the predicted total number of (invasive) species. Solid dot = end of observed data from surveys. |