|
||
|
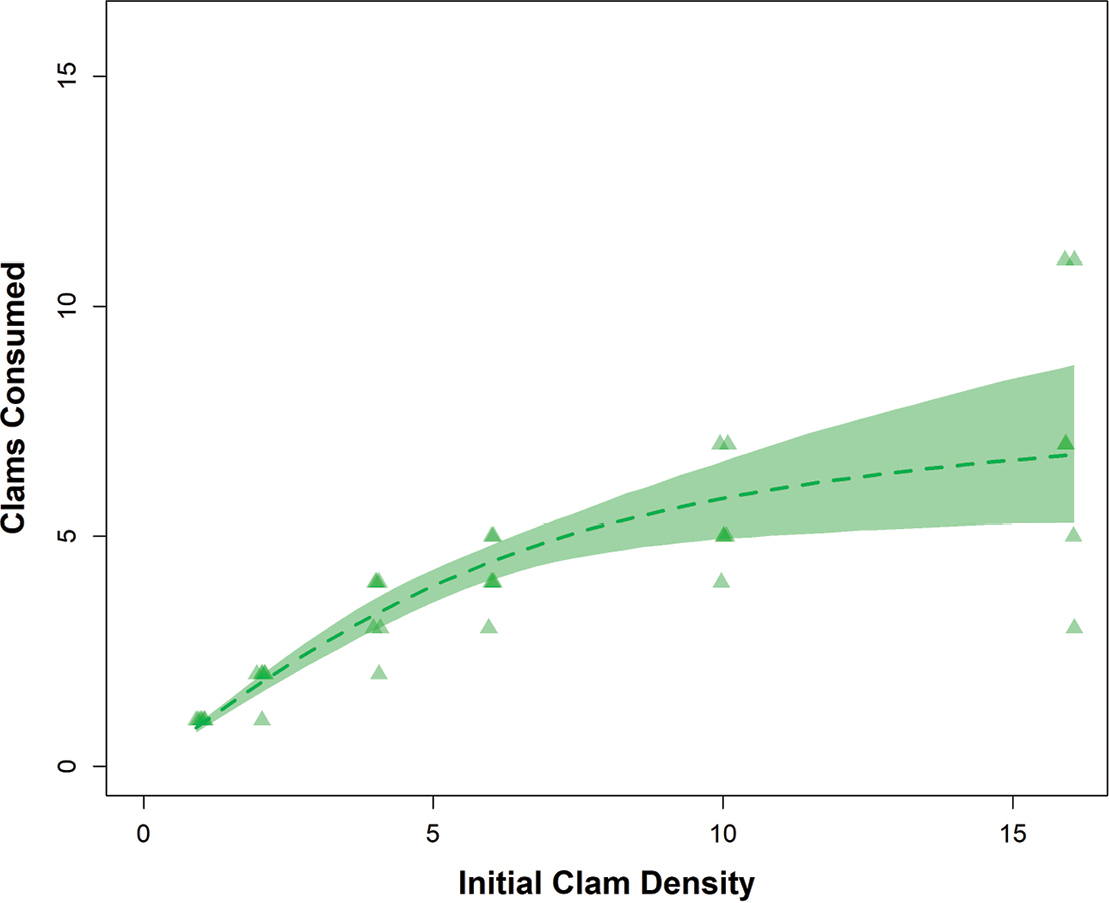
Functional response curve of green crab feeding on varnish clams in the absence of substrate. The triangles show the mean number of varnish clams consumed as a function of initial clam density (1, 2, 4, 6, 12 or 16 per trial). The Type II FR curve is represented by the dashed line with the bootstrapped 95% confidence interval represented by the shaded ribbon. |