|
||
|
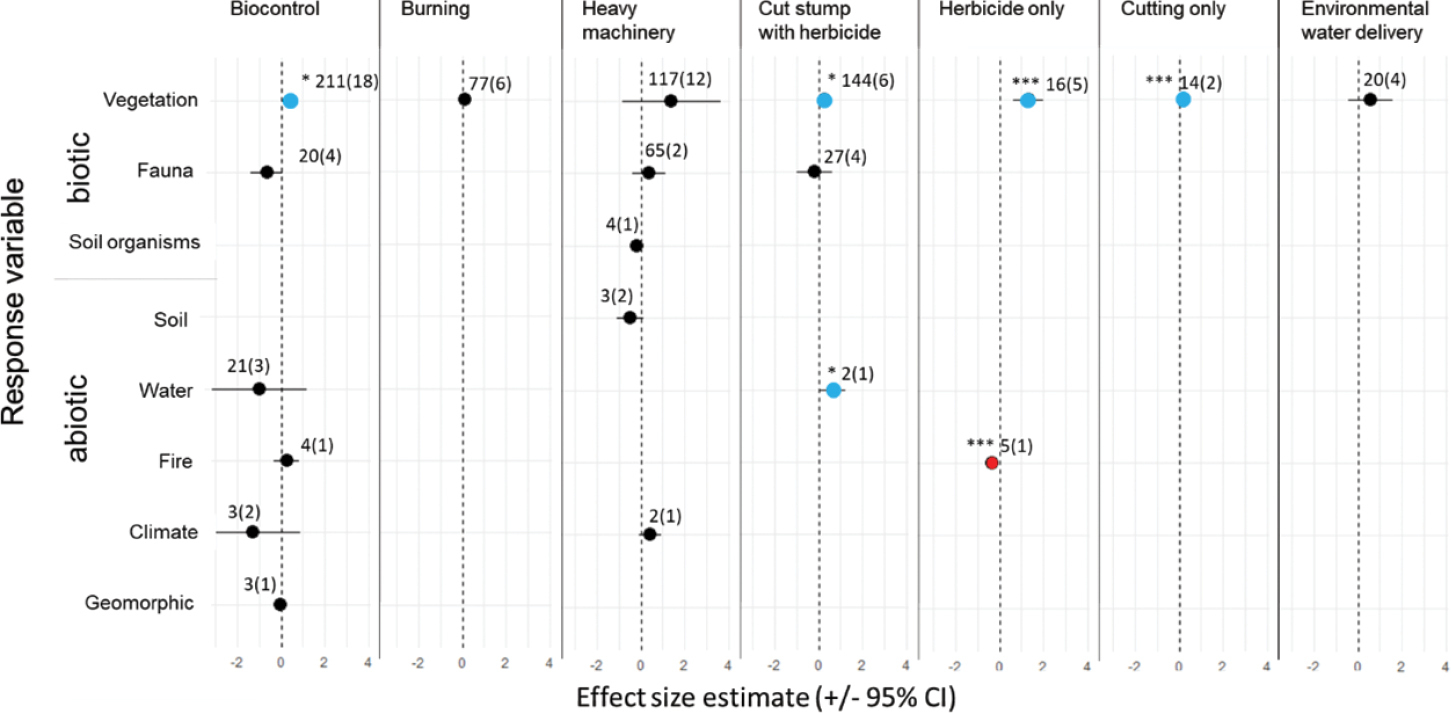
Summary of quantitative meta-analysis examining responses of multiple ecosystem components to control of Tamarix by multiple methods as reported in published papers. Dots represent the effect size estimate, calculated as the standardised mean difference. Horizontal lines represent 95% confidence intervals and vertical dotted lines denote zero. Asterisks next to dots indicate statistical significance; sample sizes are shown next to dots with number of studies reported in parentheses. Blue dots represent significantly positive effect sizes and red dots represent significantly negative effect sizes. |