|
||
|
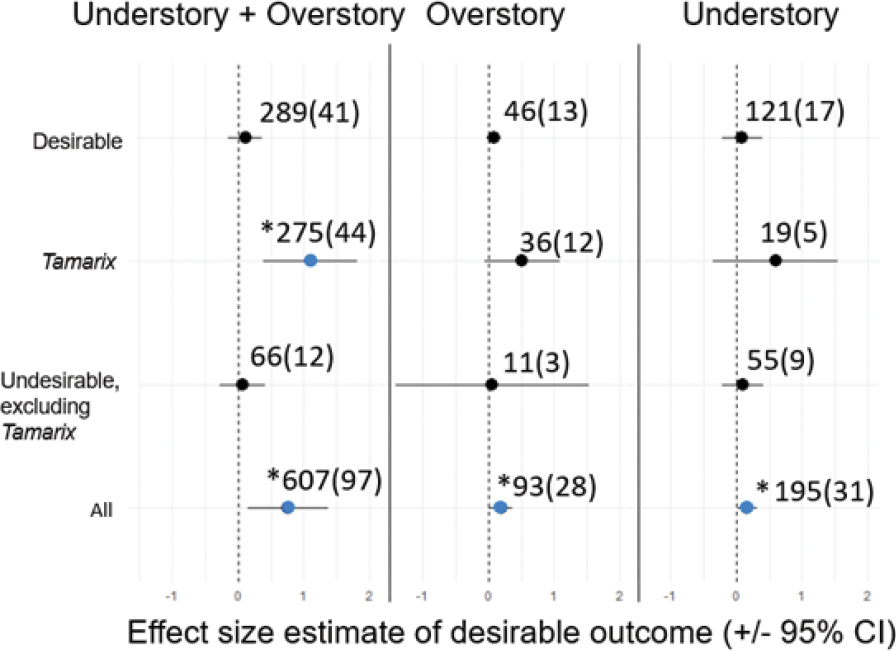
Summary of quantitative meta-analysis of vegetation-only data from published sources (for all treatment methods used to control Tamarix) by vegetation types (understorey/overstorey/both, desirable/undesirable/all). Dots represent the effect size estimate, calculated as the standardised mean difference. Horizontal lines represent 95% confidence intervals and vertical dotted lines denote zero. Asterisks next to dots indicate statistical significance; sample sizes are shown next to dots with number of studies reported in parentheses. Blue dots represent significantly positive effect sizes. |