|
||
|
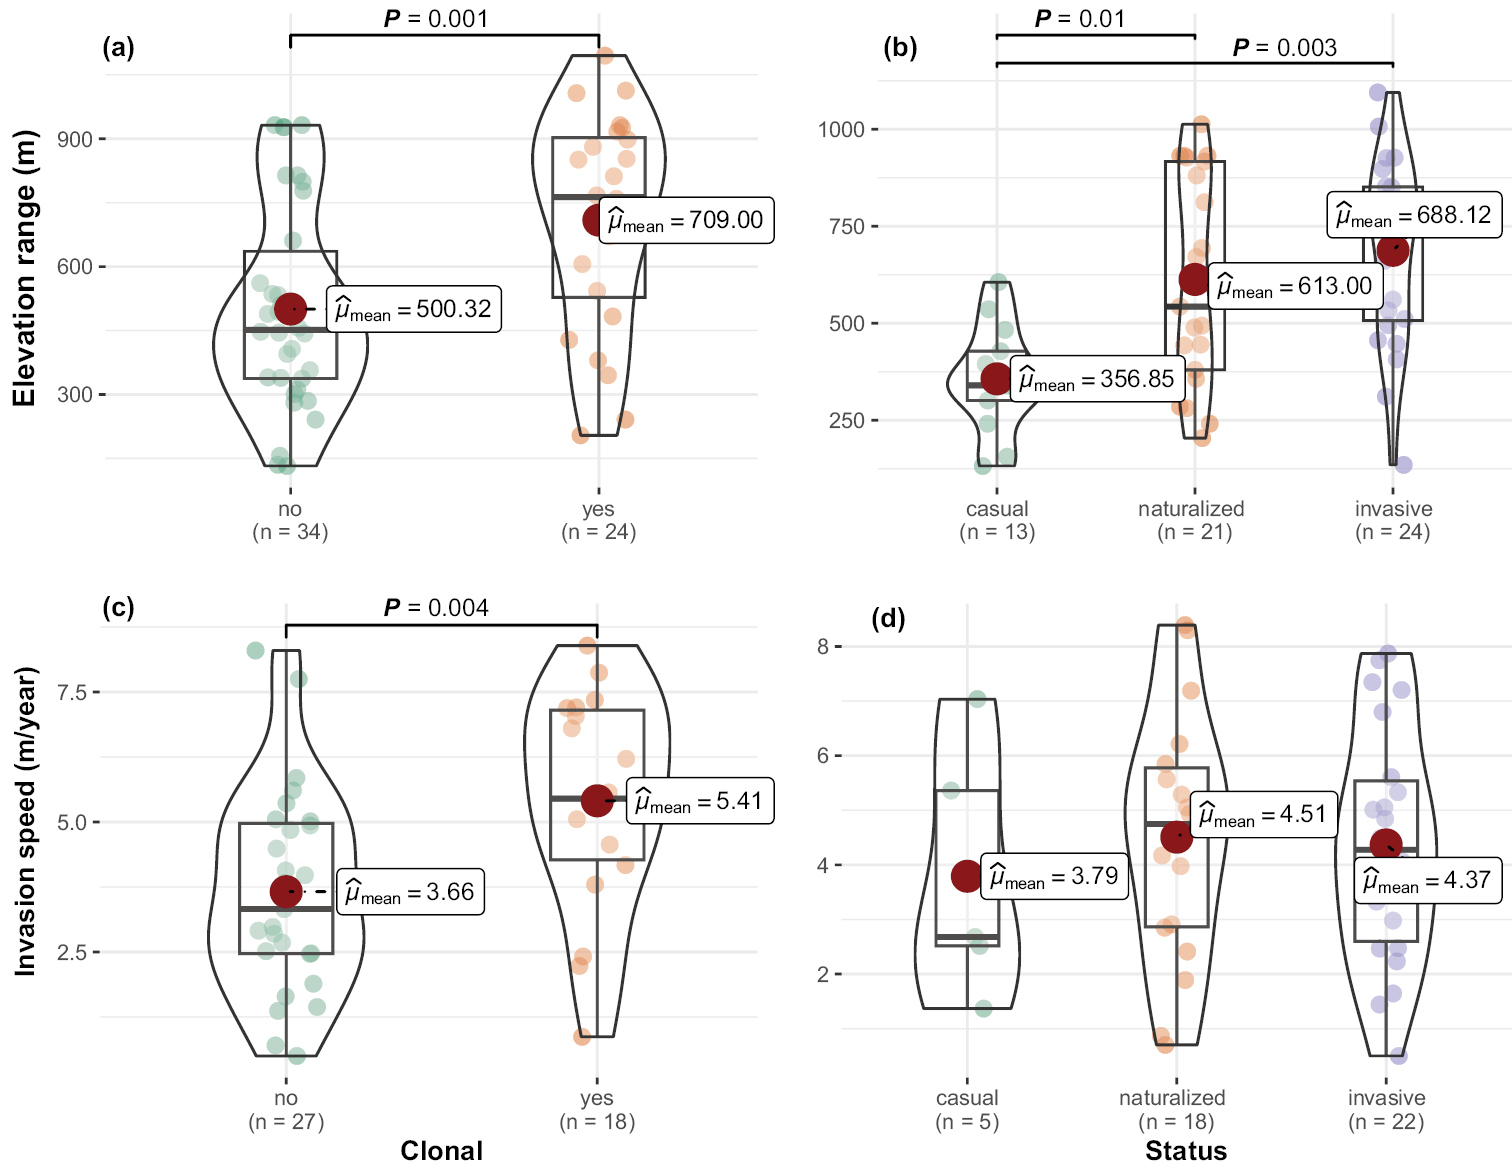
Violin plots showing the elevation ranges and invasion speeds of the examined alien species, categorized based on their clonality and invasion status. Note that the invasion speed was only available for 45 species. For the boxplots inside each violin plot, the horizontal line, red dot, and box, respectively, represent the median, the mean, and the interquartile range. P-values were obtained from phylogenetic ANOVAs and showed in the upper part of the violin plot if significant (P < 0.05). |