|
||
|
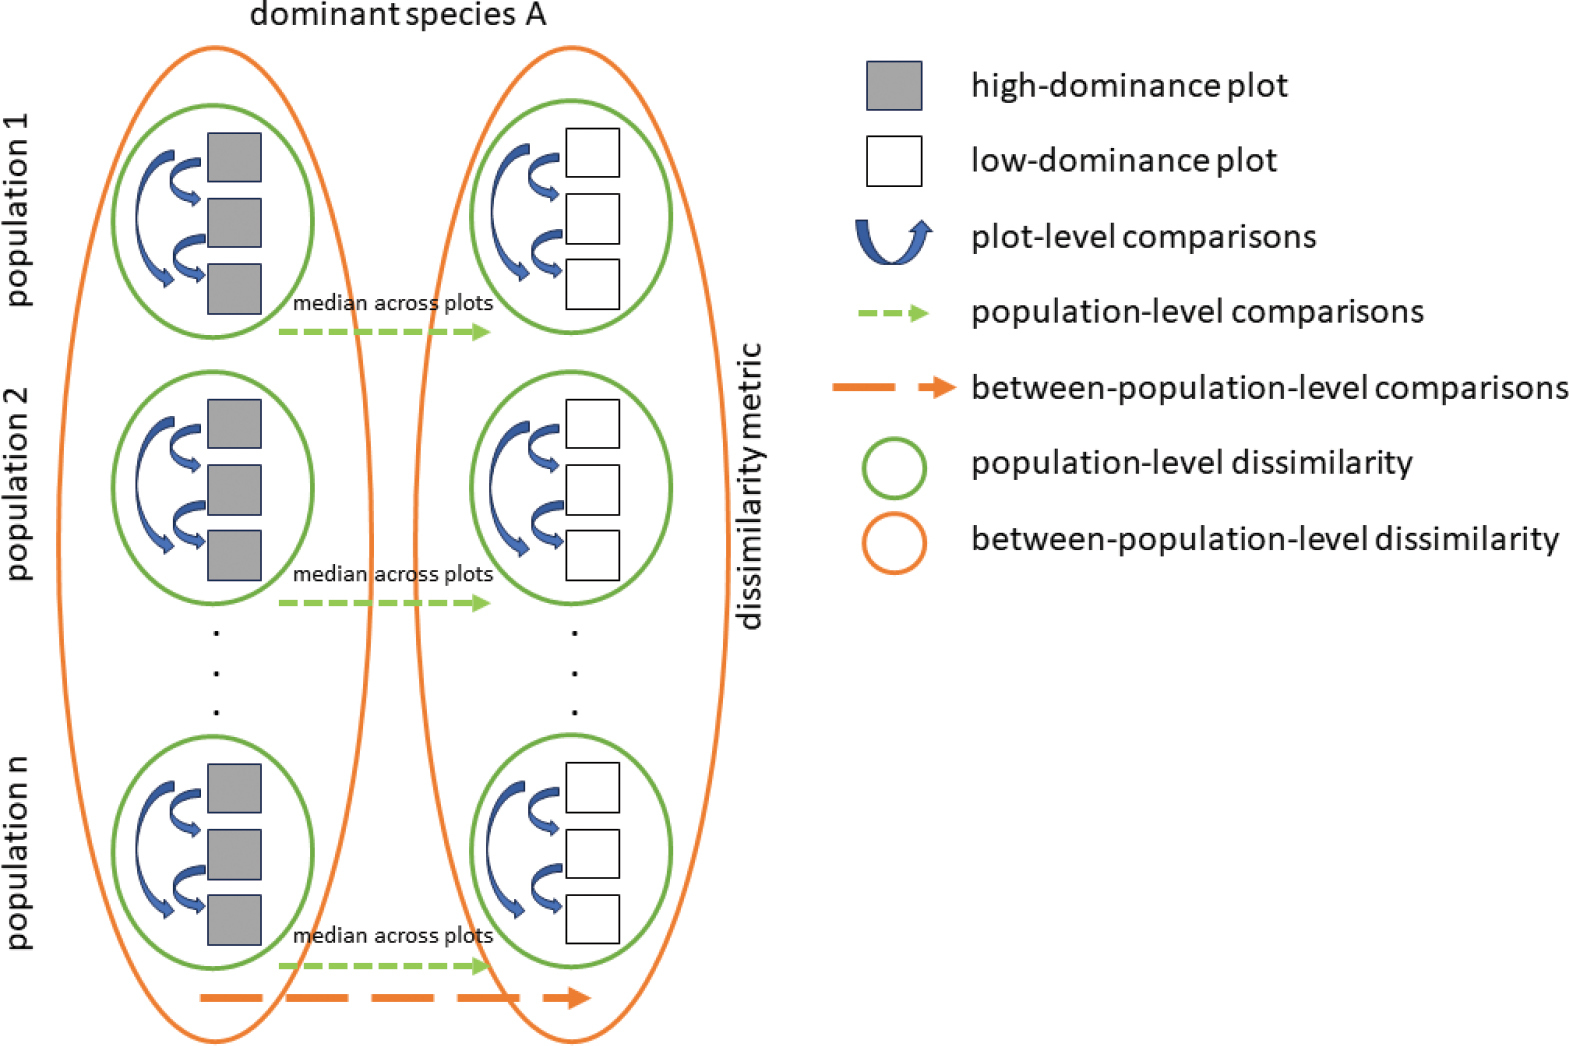
Scheme of our sampling design and how the impacts were estimated. The plot level is marked with blue arrows, the population level is marked with dashed green arrows, and the between-population level with the dashed orange arrows. In each population, the median value across all high-dominance plots and the median value across all low-dominance plots were computed; these median values of high and low-dominance plots were then compared in the analyses. |