|
||
|
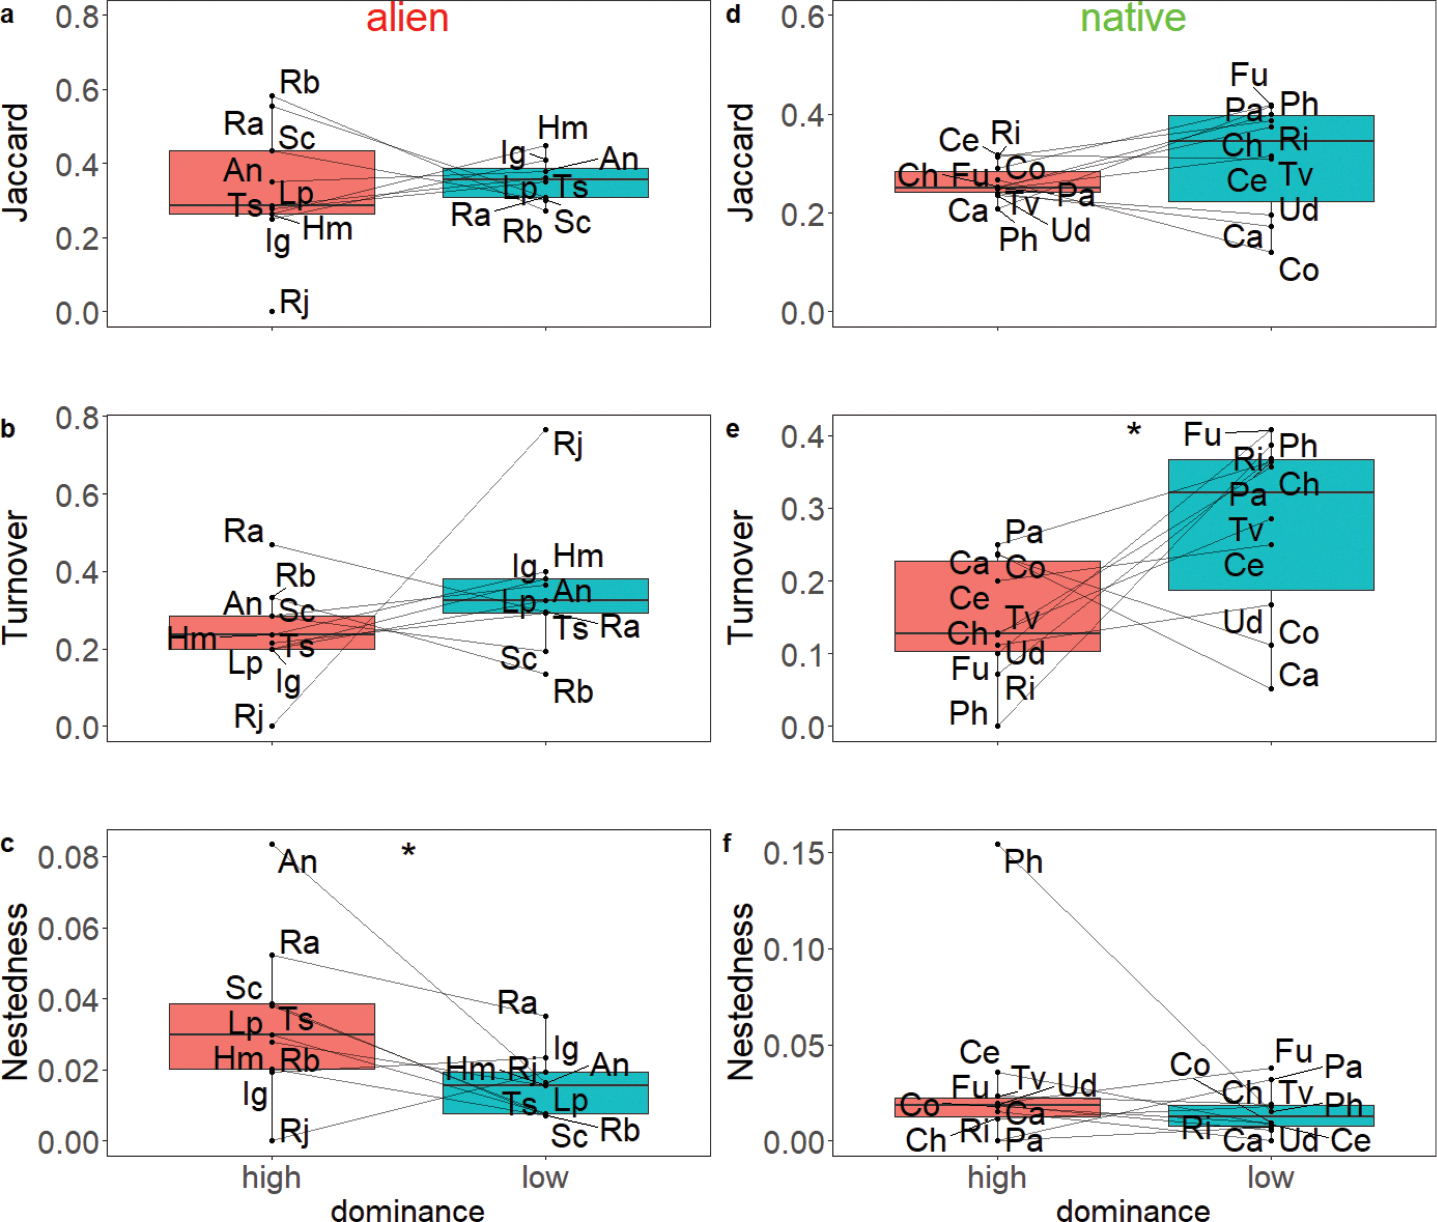
Between-population level results for all species. Each dot represents the median value across all sites of the same species at a certain dominance category (high or low); each line connects the dominance category of a species. Alien dominants (a-c) show higher levels of nestedness in high-dominance plots compared to low-dominance plots, whereas native dominants (d-f) show lower levels of turnover in high-dominance plots compared to low-dominance plots. Alien species: An: Aster novi-belgii agg., Hm: Heracleum mantegazzianum, Ig: Impatiens glandulifera, Lp: Lupinus polyphyllus, Rj: Reynoutria japonica, Rb: Reynoutria × bohemica, Ra: Rumex alpinus, Sc: Solidago canadensis, Ts: Telekia speciosa; native species: Ce: Calamagrostis epigejos, Ca: Cirsium arvense, Ch: Cirsium heterophyllum, Co: Cirsium oleraceum, Fu: Filipendula ulmaria, Ph: Petasites hybridus, Pa: Phalaris arundinacea, Ri: Rubus idaeus, Tv: Tanacetum vulgare, Ud: Urtica dioica. |