|
||
|
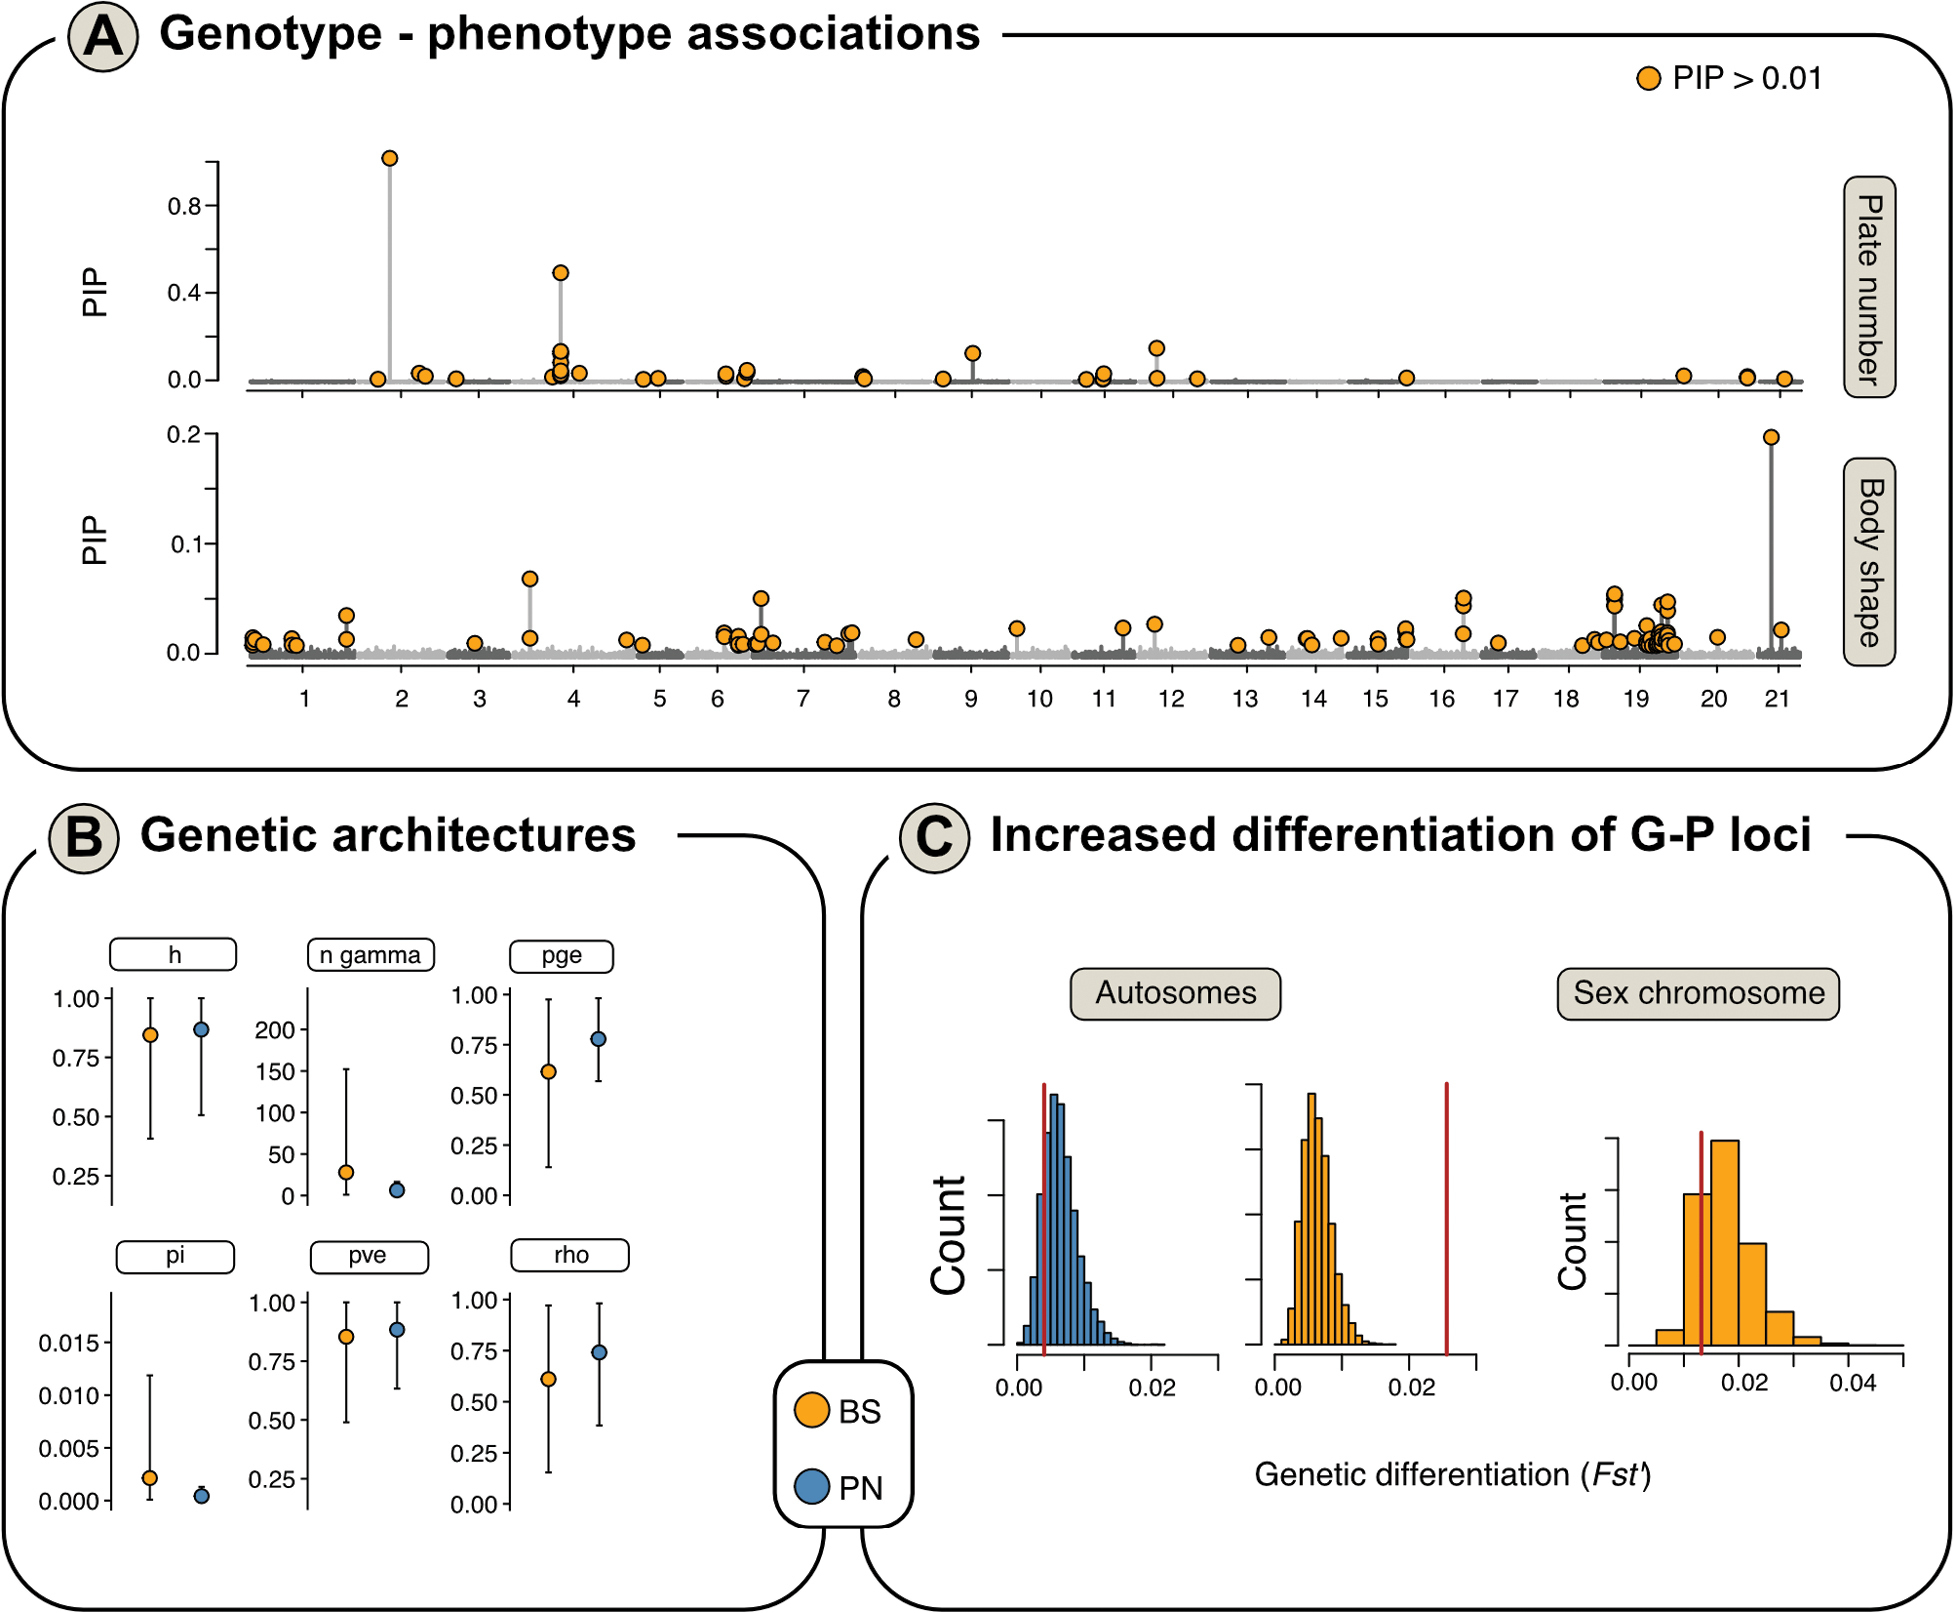
Genome-wide association analyses (GWAS) for phenotypic traits A posterior Inclusion Probabilities (PIP) from BSLMMs for all SNPs (dots) across the genome are shown, with outliers SNPs passing significance threshold (PIP > 0.01) shown in red. Manhattan plots are shown for GWAS results with mean lateral plate number, body shape PC1-6 and total length B hyperparameters from BLSMMs are plotted, as the mean (large dot) and 95% confidence intervals (grey lines), for body shape (BS: yellow) and lateral plate number (PN: blue) C the distribution of genetic differentiation (FST‘) values for the permuted null distribution is shown as a histogram and mean differentiation for phenotype-associated loci is indicated as a red line. Results are shown for SNPs associated with later plate number (blue) and body shape (yellow), for autosomes and the sex chromosome separately. No trait-associated SNPs were detected for later plate number on the sex chromosome. |