|
||
|
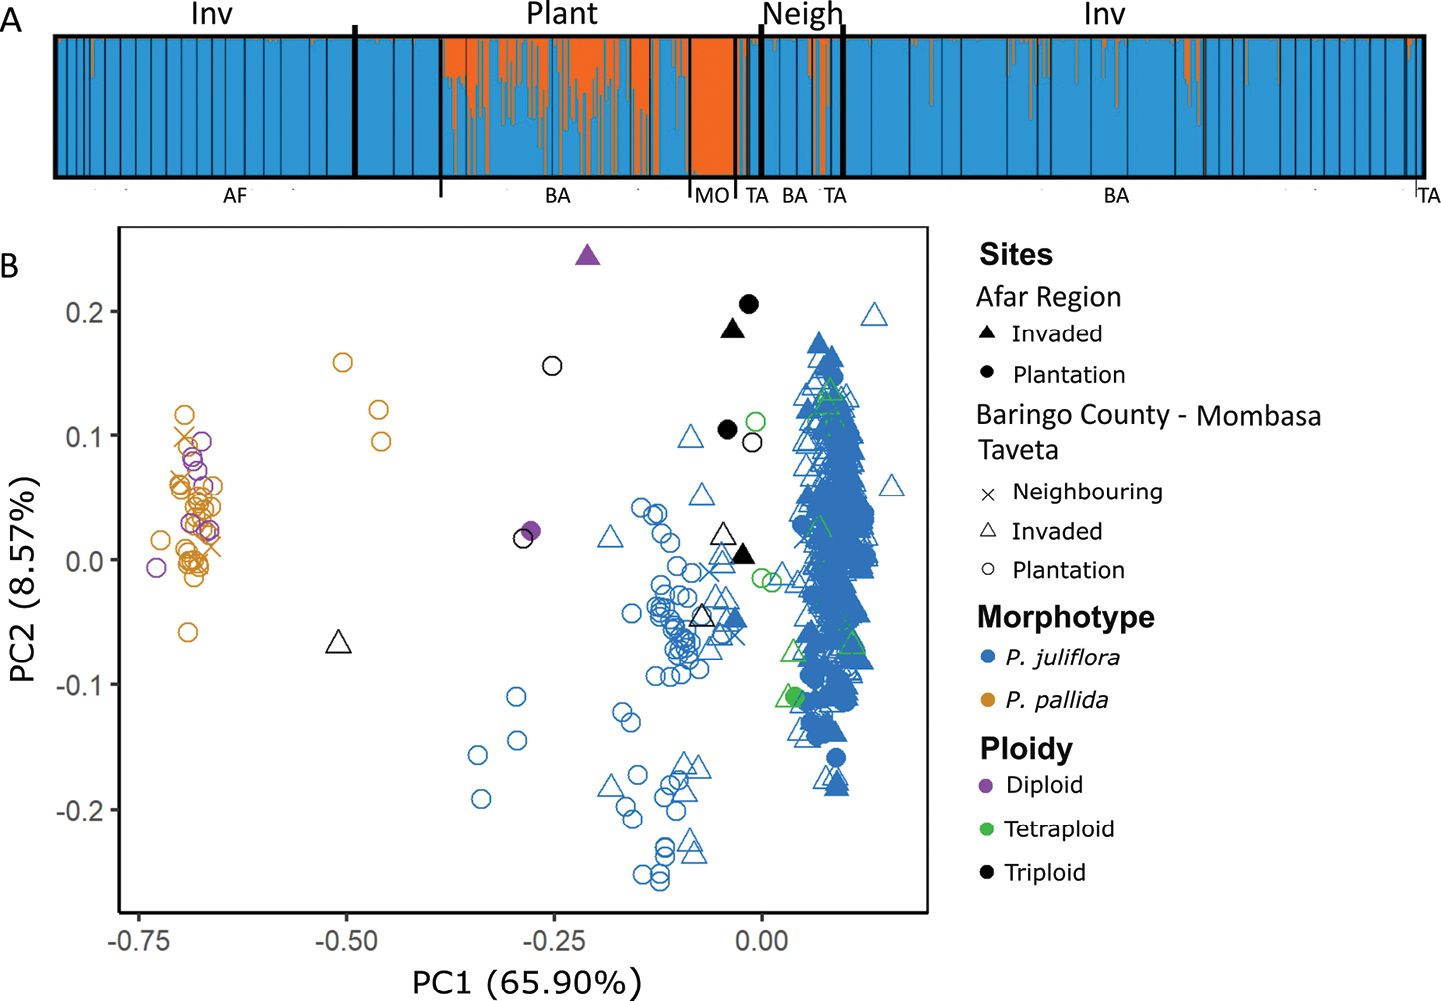
Genetic structure among Prosopis individuals from Kenya and Ethiopia based on STRUCTURE and Principal component analyses A STRUCTURE bar plots where vertical line plots illustrate the proportional assignment (qik values) of individual genomes to the inferred two genetic clusters, cluster 1 in blue and cluster 2 in orange; and for all P. juliflora, P. pallida morphotypes from plantations (Plant), sites of neighbouring plantations (Neigh) and far-off invaded sites (Inv) from the Afar Region in Ethiopia (AF), Baringo County (BA), Mombasa (MO) and Taveta (TA) in Kenya B principal component analysis (PCA) showing P. juliflora and P. pallida morphotypes and ploidy of individuals from flow cytometry results (see text for further details and Suppl. material 2). PCA was performed using Bruvo distances calculated using PolySat (Bruvo et al. 2004). |