|
||
|
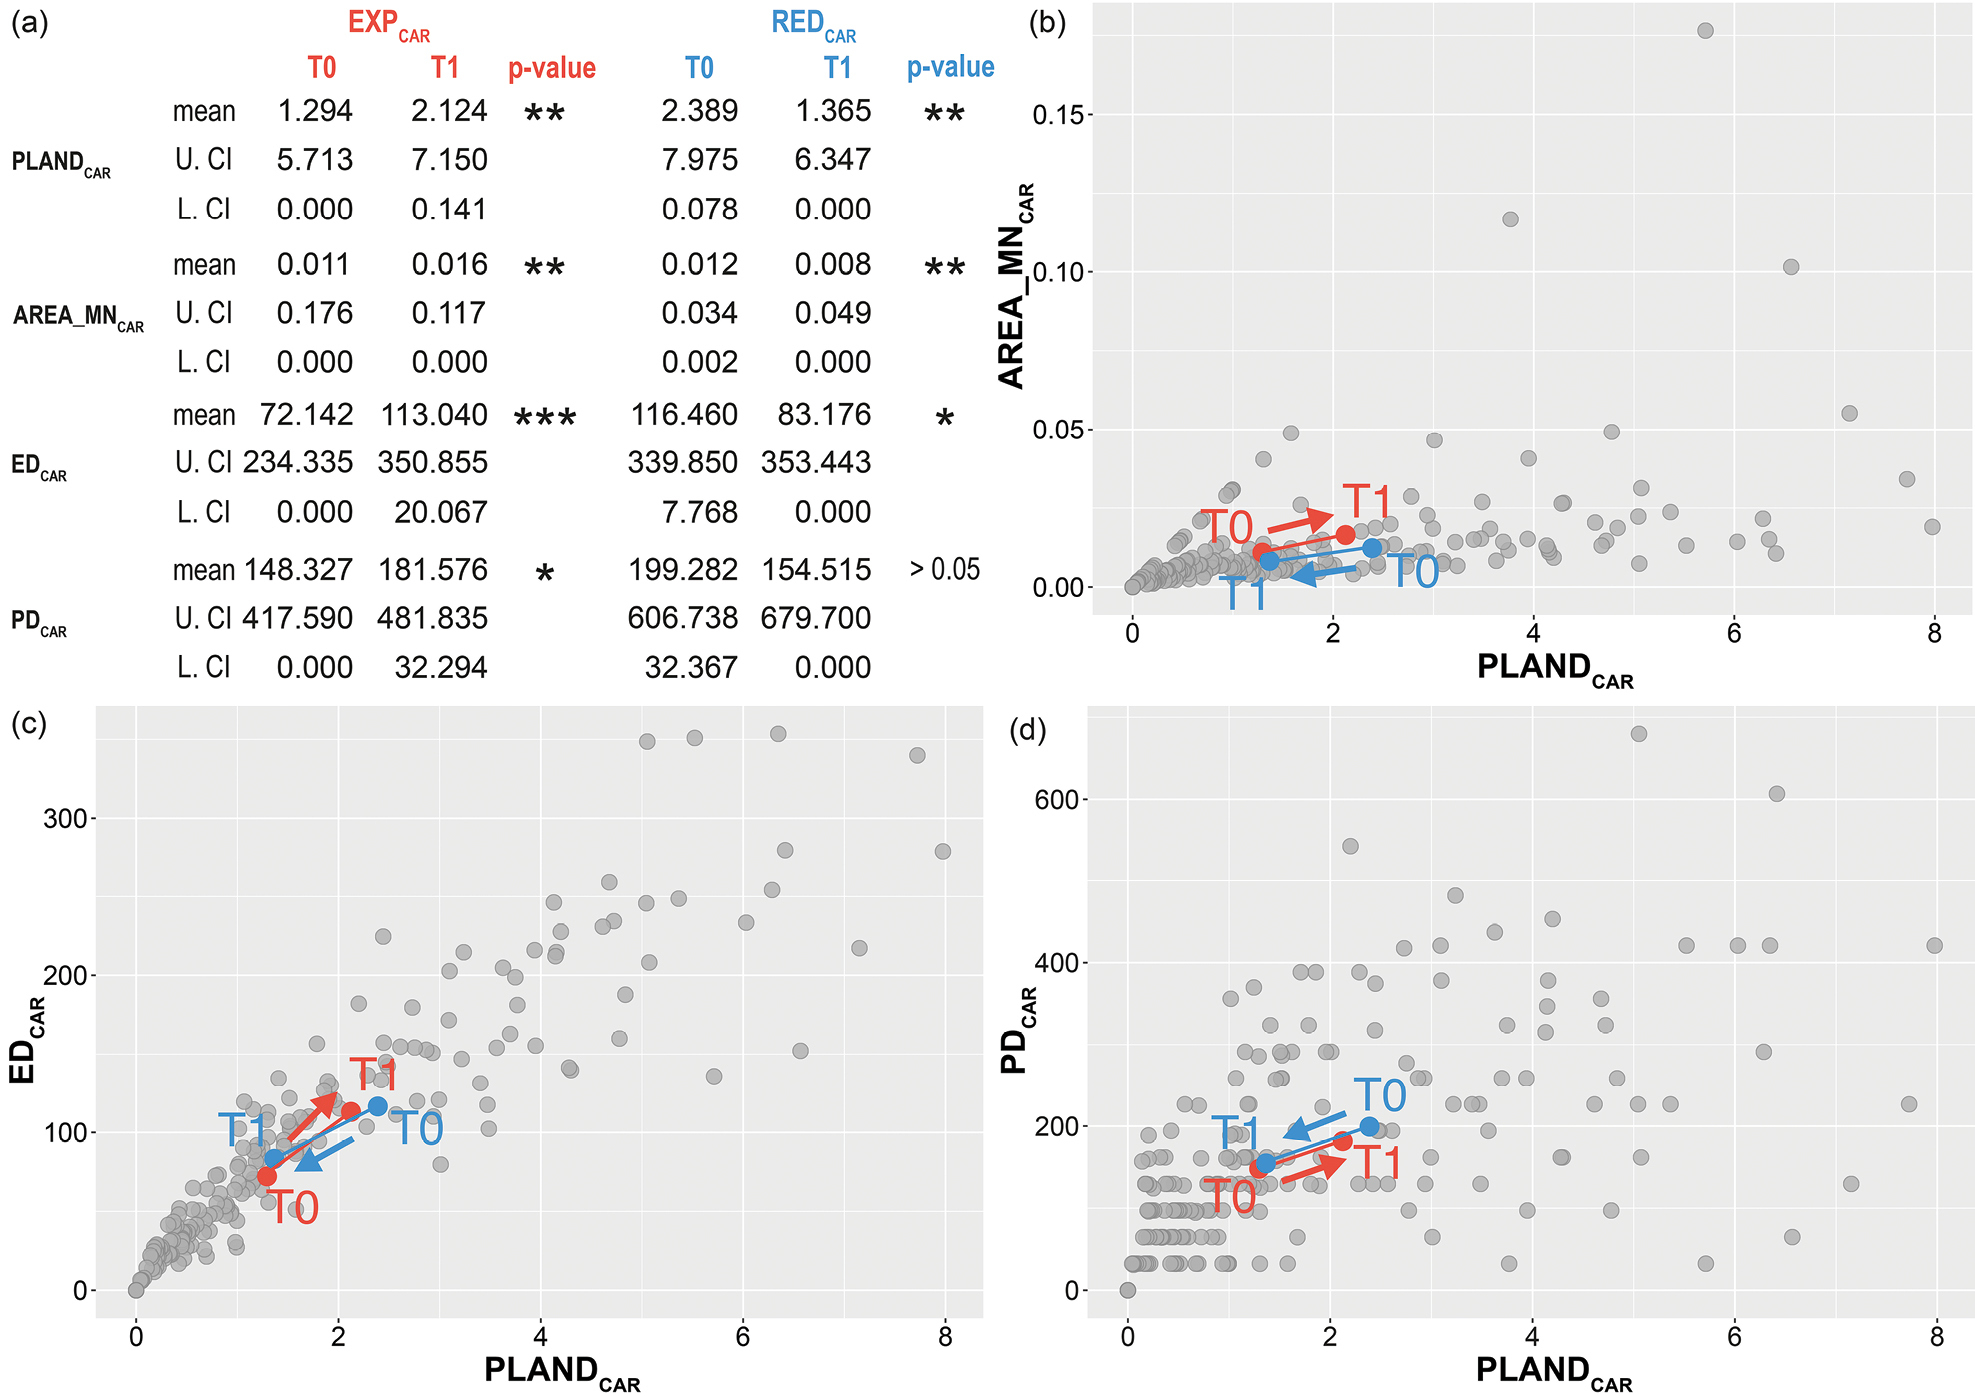
Comparison of Carpobrotus spp. pattern metrics (PLANDCAR, PDCAR, EDCAR, AREA_MNCAR) over time (from T0 to T1) in tracts of expansion (red: EXPCAR) and reduction (blue: REDCAR). a Kruskal-Wallis comparison of means and the respective confidence intervals (upper – U. CI, lower – L. CI; * = p-value < 0.05, ** = p-value < 0.01, *** = p-value < 0.001) b–d report the trajectory analysis of Carpobrotus spp. patches area (AREA_MNCAR), edge density (EDCAR) and patch density (PDCAR) in relation to overall Carpobrotus spp. cover (PLANDCAR). Grey dots represent the observed values of pattern metrics, coloured dots the arithmetic mean (mean of PLANDCAR, PDCAR, EDCAR, AREA_MNCAR) in each date (T0 and T1) in EXPCAR and REDCAR and arrows indicate the direction of temporal change. |