|
||
|
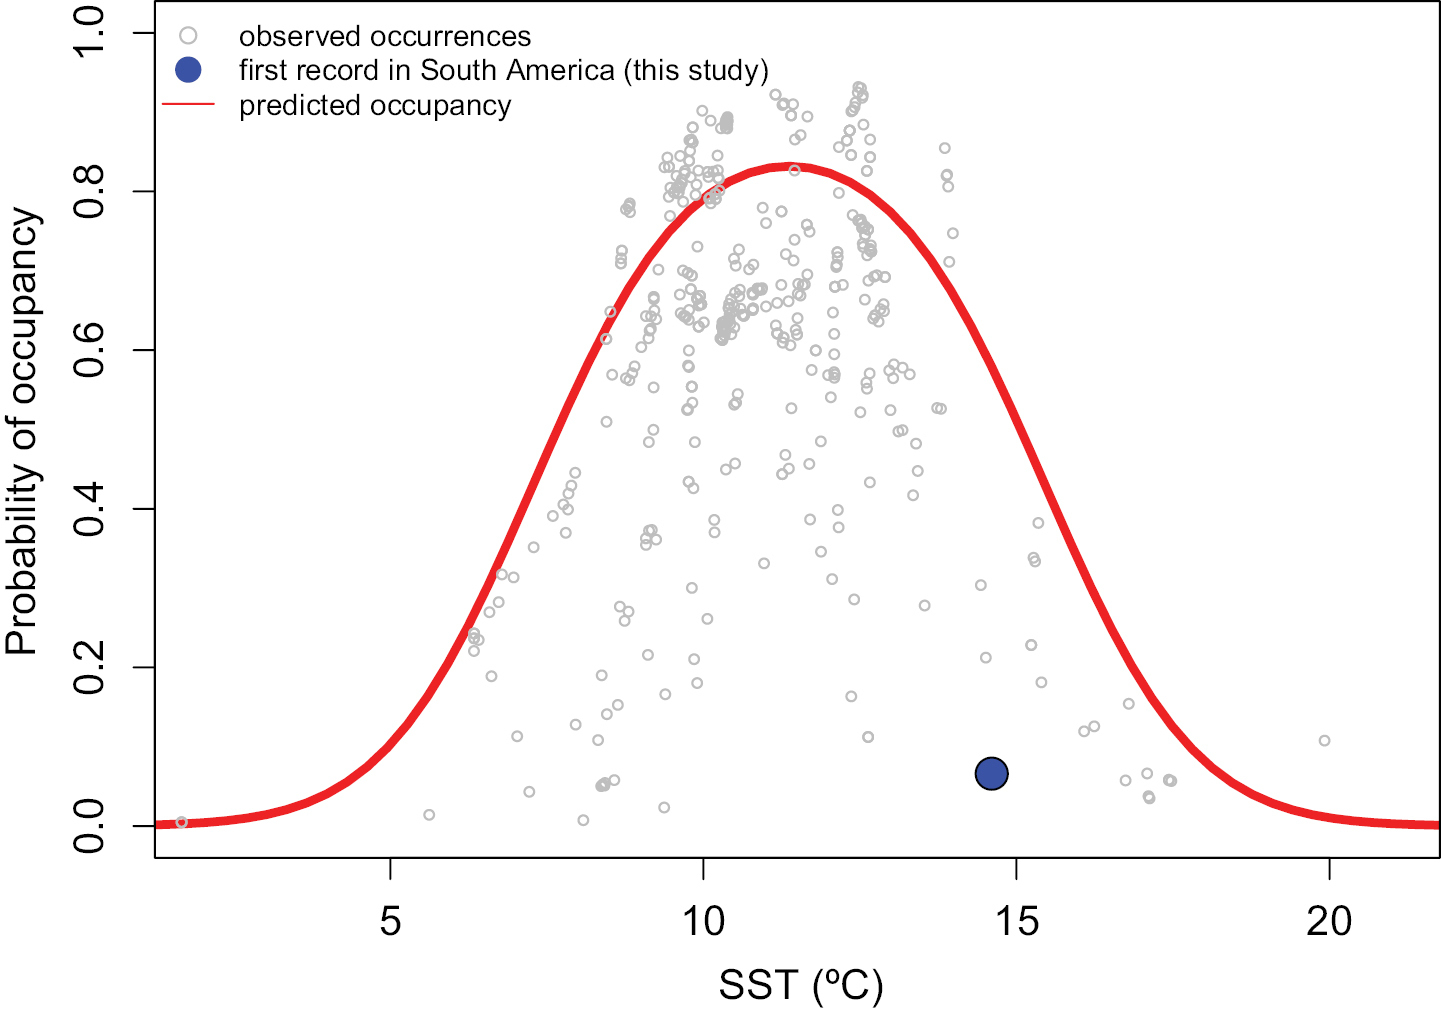
Functional relationships between occupancy probability and mean water temperature according to the species distribution model. Each empty dot represents the occupancy probability estimated for each global georeferenced occurrence. The red line shows the partial dependence plot of the isolated effect of mean water temperature on the occupancy probability. The blue dot indicates the new occurrence site in La Herradura Bay, Chile. |