|
||
|
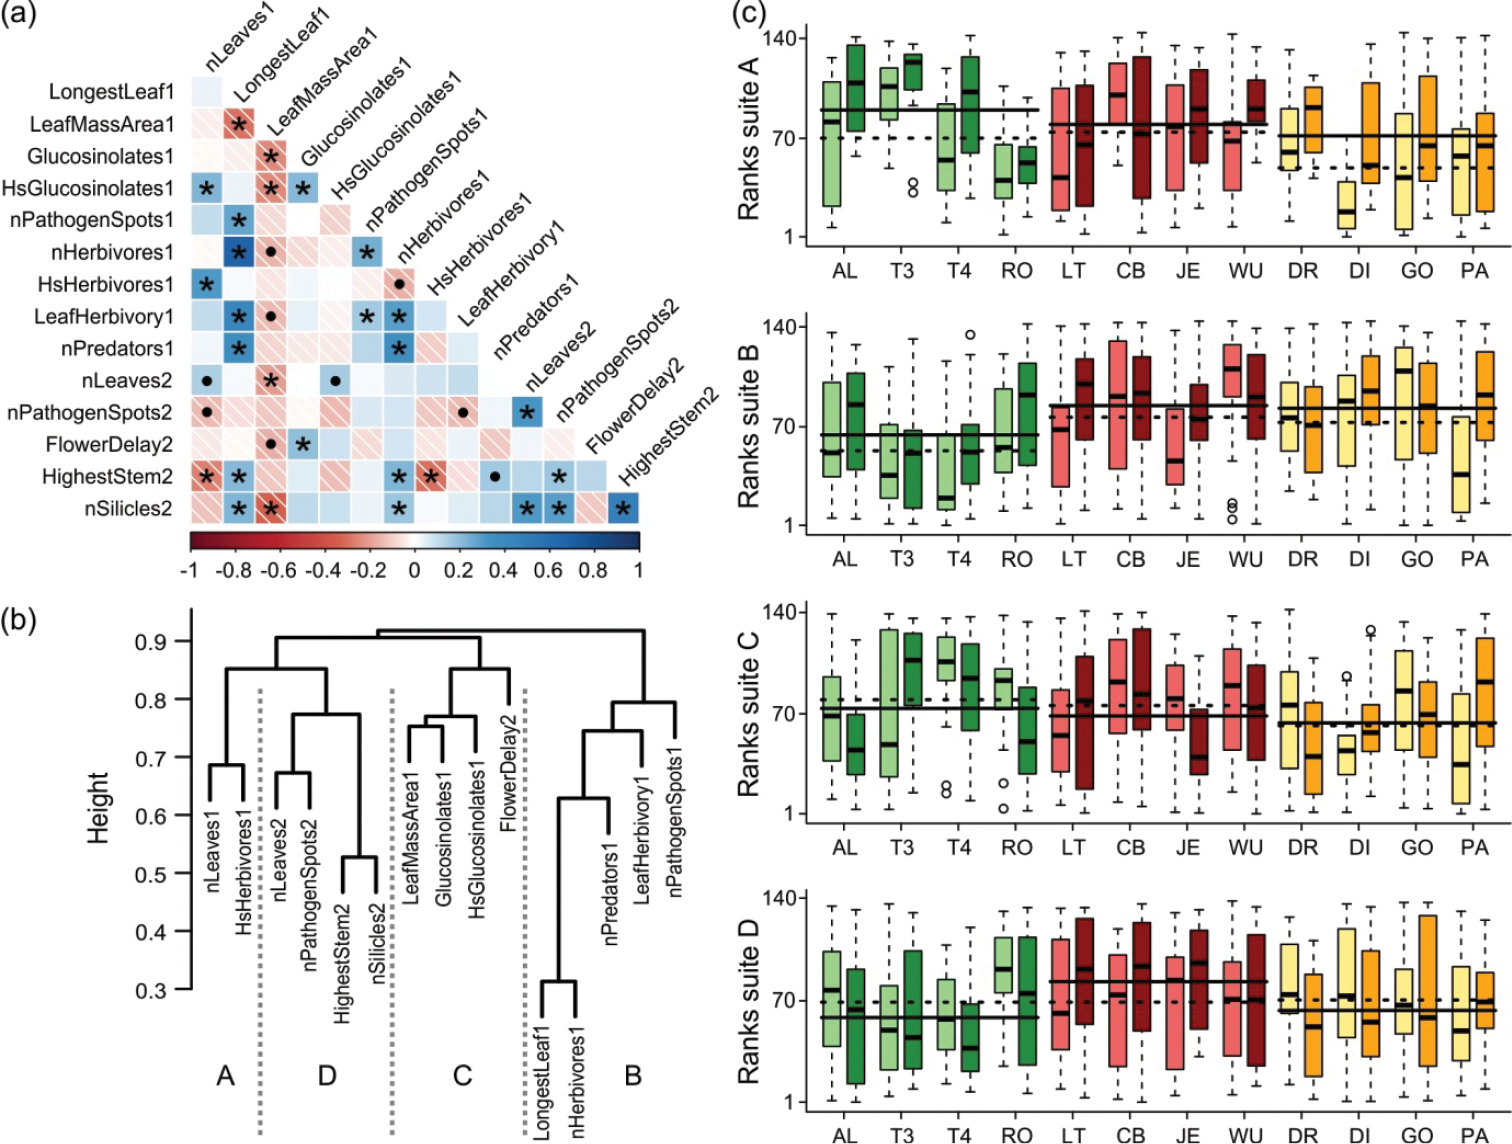
Rank-based correlations and clustering amongst individual traits of Bunias orientalis plants. Twelve populations were grown in a field common garden over two years. a Pairwise correlations of traits with heatmap shadings based on Spearman’s rho (n = 131–144 individuals in pairwise comparisons). Correlations are marked as positive (blue) or negative (red, hatched fields). Asterisks: significant correlations, P < 0.05; dots: tendencies, P < 0.1. b Agglomerative cluster analysis (coefficient 0.3) of traits based on 1 minus Spearman’s rho values as pairwise distances (UPGMA method). Dashed lines divide four suites of consistently correlated traits (Spearman’s rho; Kendall’s W, each P < 0.001), identified using silhouette plots (not shown). LeafMassArea: leaf mass per area; Hs: diversity of (Shannon index); 1, 2: year the trait was obtained. c Combined ranks of the four suites from (b), displayed over 12 populations of native (green), invasive (red) or naturalised (yellow) status grown under two fertilisation treatments, low (light shade) and high (dark shade); for population codes see Table 1. From top to bottom: suite A (n = 12 per population and fertilisation treatment), B (n = 30), C (n = 20–24) and D (n = 18–24). Box plots: median, 5th, 25th, 75th, 95th percentiles; open dots: outliers. Lines along four populations of identical status: status mean values for low (dashed) and high (solid) fertilisation treatments. |