|
||
|
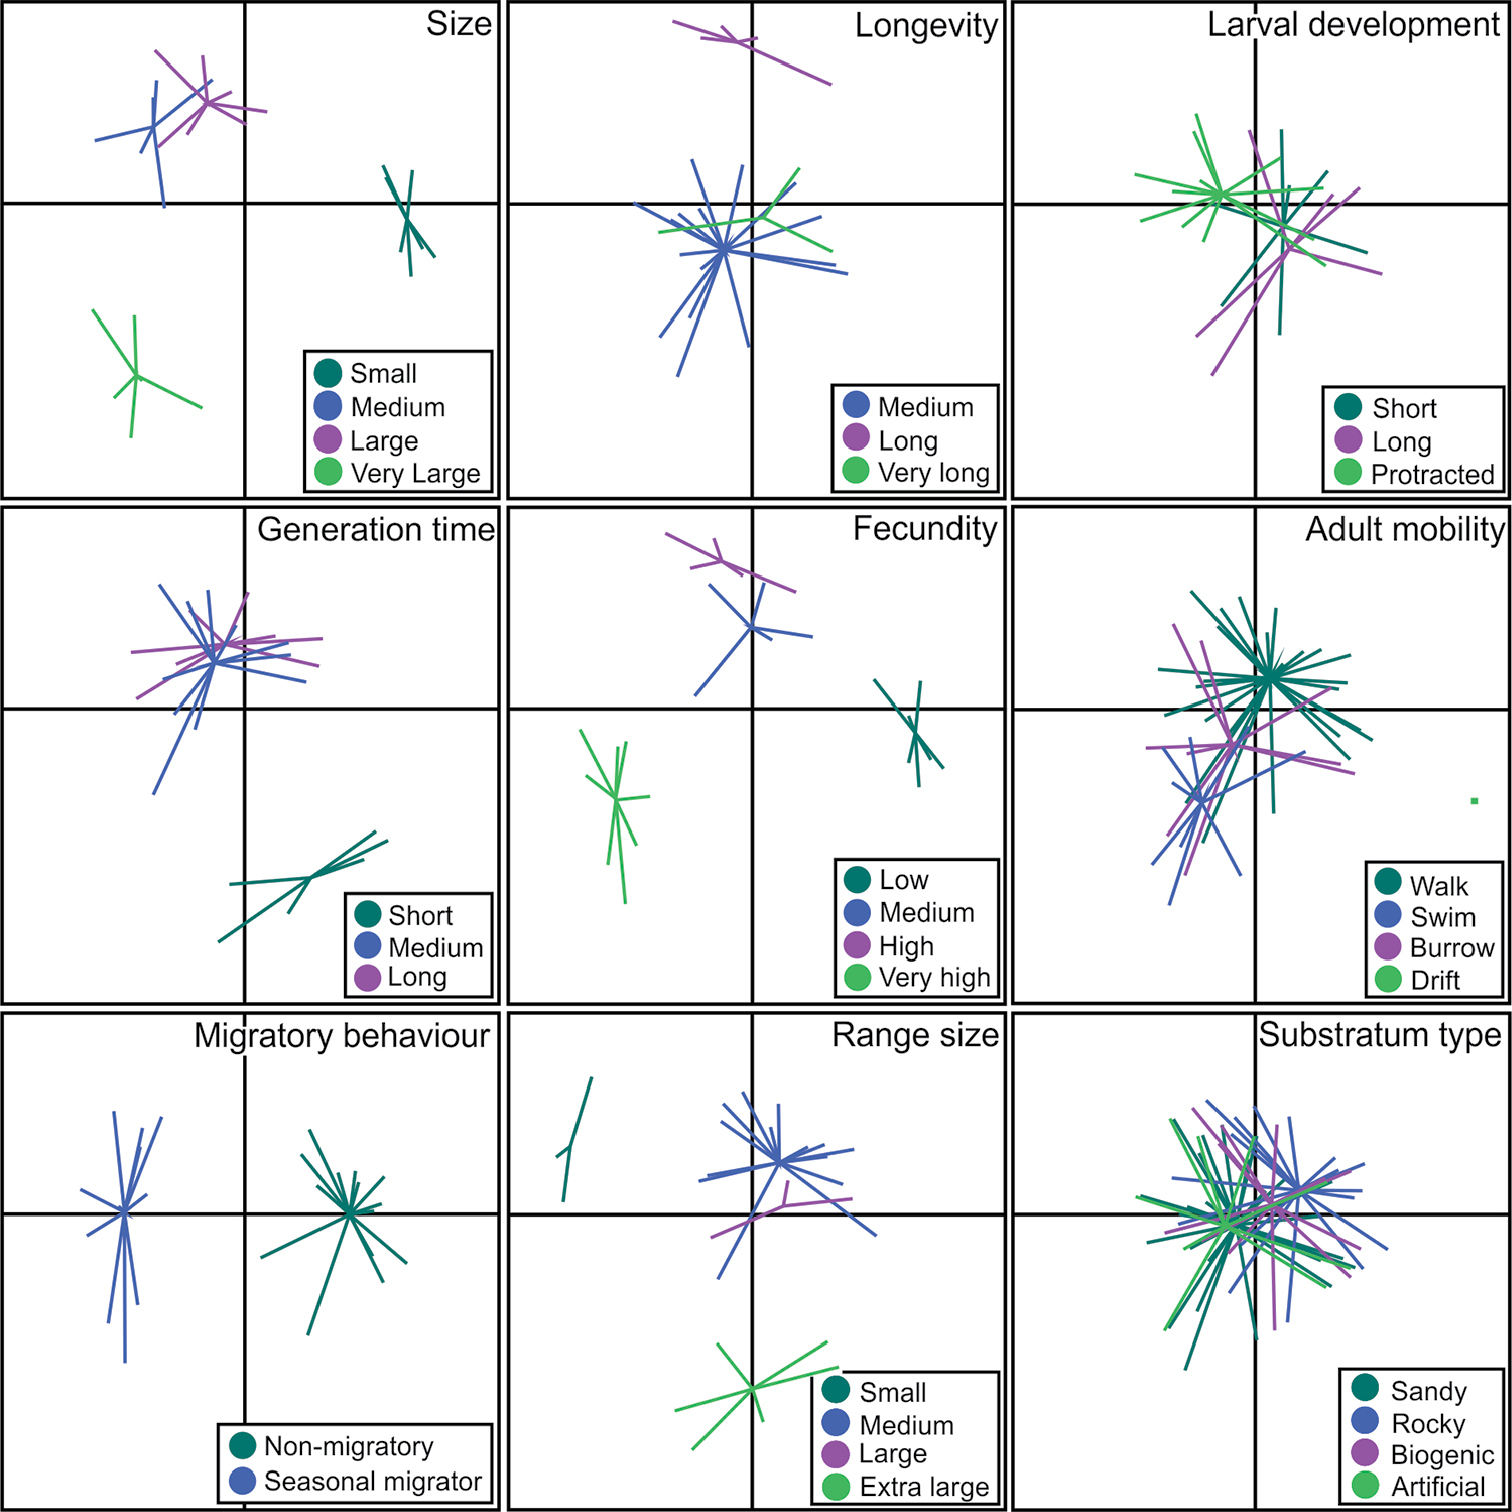
Fuzzy Correspondence Analysis bidimensional plot depicting the nine traits analysed. Each graph represents a single trait and the stars represent the categories within that trait. |
|
||||||||
| Part of: Swart C, Visser V, Robinson TB (2018) Patterns and traits associated with invasions by predatory marine crabs. NeoBiota 39: 79-102. https://doi.org/10.3897/neobiota.39.22002 |