|
||
|
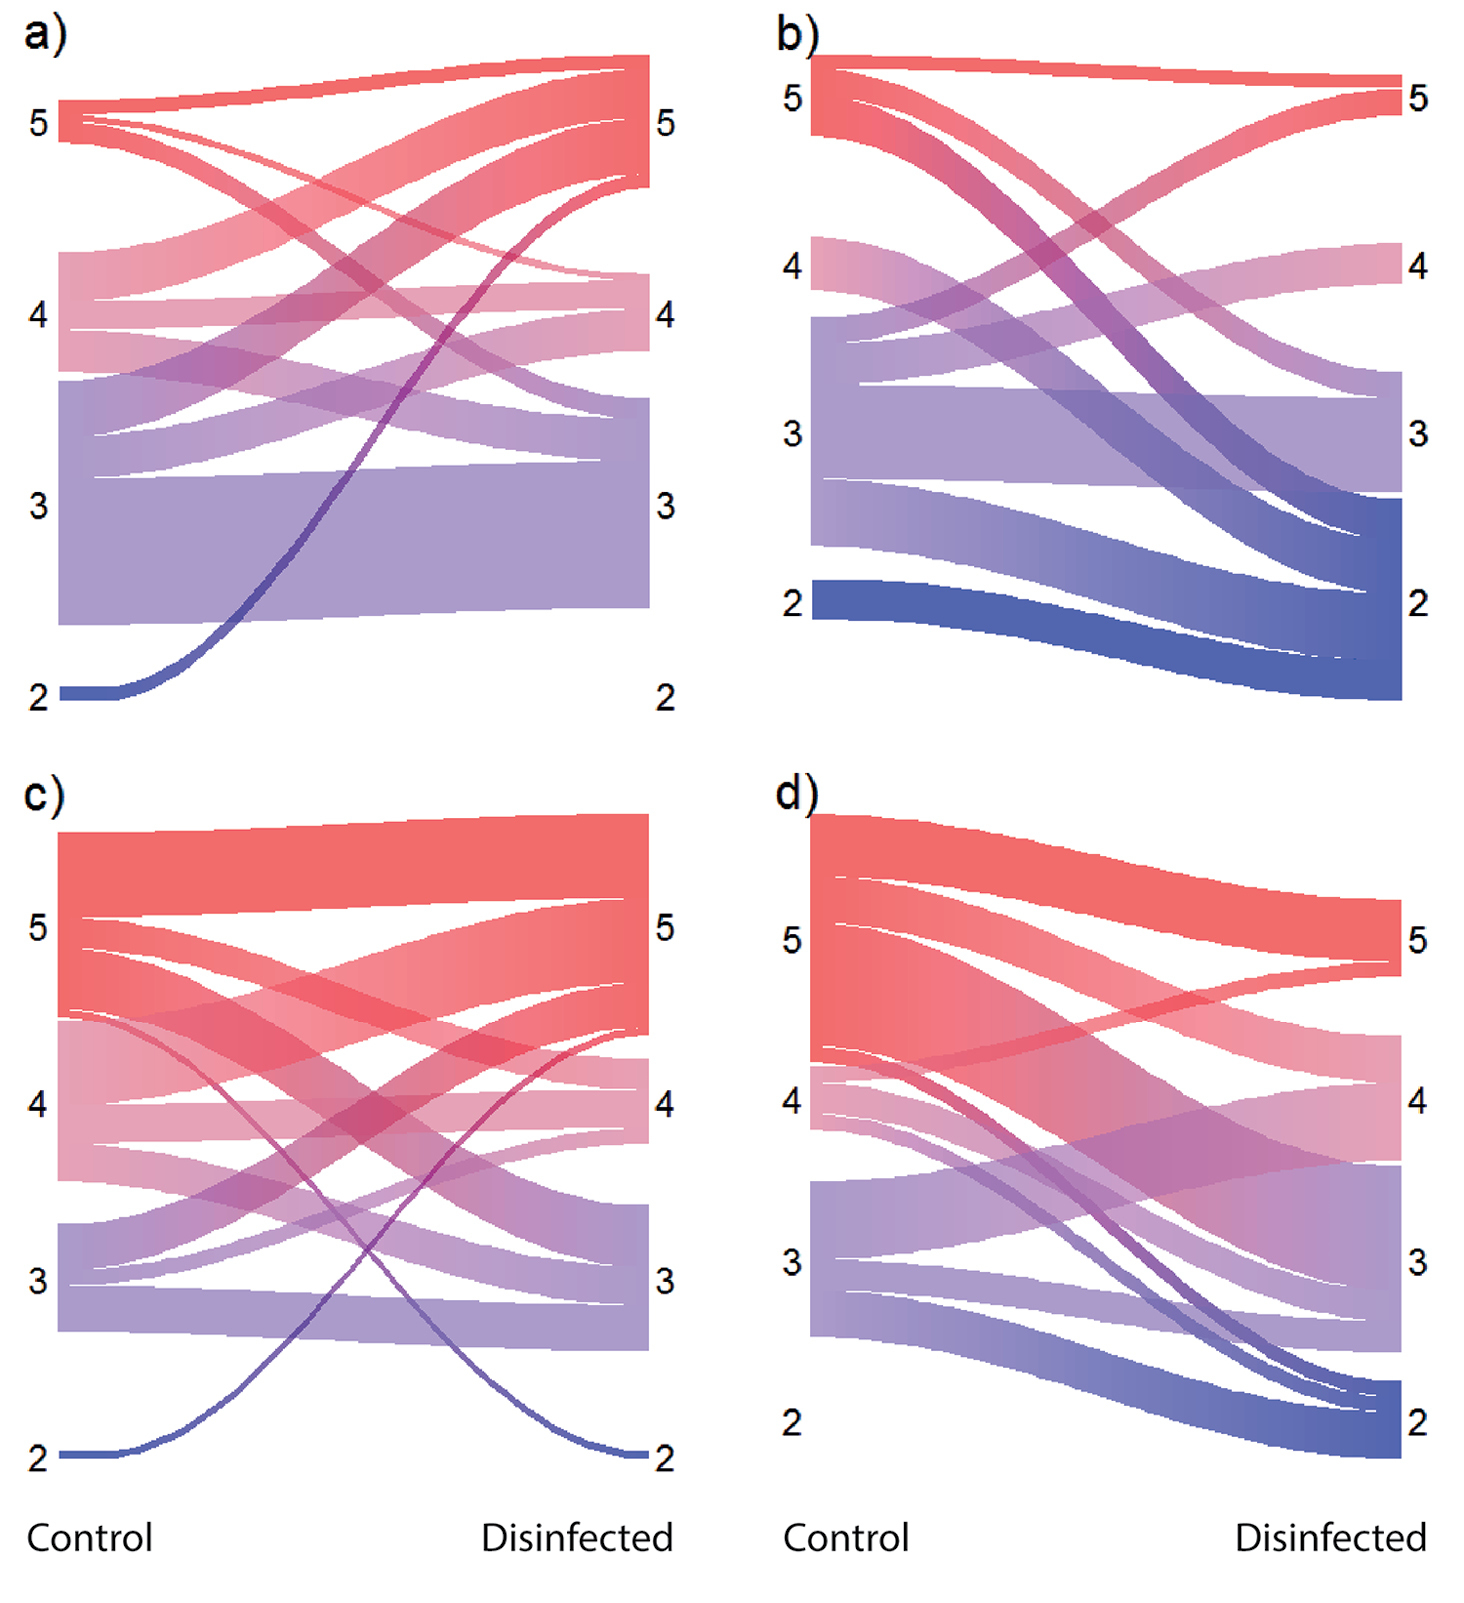
Flow diagram visualising the efficacy of footwear disinfection measures aboard a cruise ship on Svalbard. Numbers on the y-axes and colours represent growth scores (see Table 1), lines connect paired control and disinfected samples and the width of lines is proportional to the number of samples in each category. a) step-through disinfection after 24 hours b) step-through disinfection combined with a prolonged drying period after 24 hours c) step-through disinfection after 48 hours d) step-through disinfection combined with a prolonged drying period after 48 hours. |