|
||
|
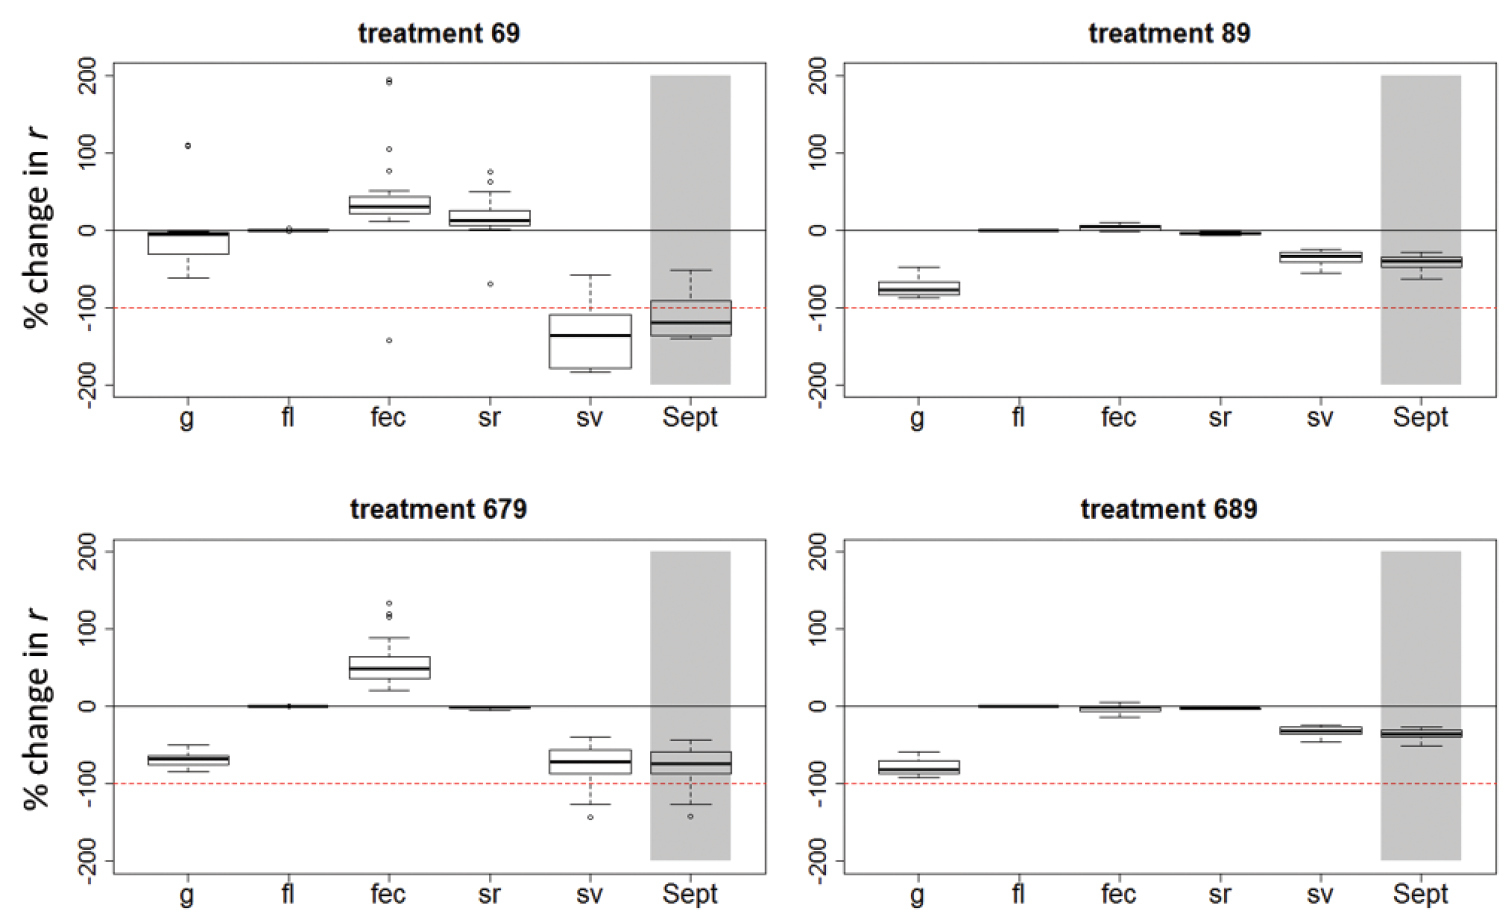
The influence of single vital rates and the September cut on population growth. Figures show the relative contributions of each vital rate (g = growth, fl = flowering, fec = fecundity, sr = seed ripening, sv = seed viability, see Fig. 1) and the cut in September (Sept, i.e. combined effect of sr and sv) to the total change in the population growth r per treatment. The y-axis represents the percentage change in r compared to the untreated reference, relative to the total change due to the mowing treatment (red dashed line at -100%). Boxplots indicate variation across reference data sets (N = 6) and years (N = 5, if applicable). |