|
||
|
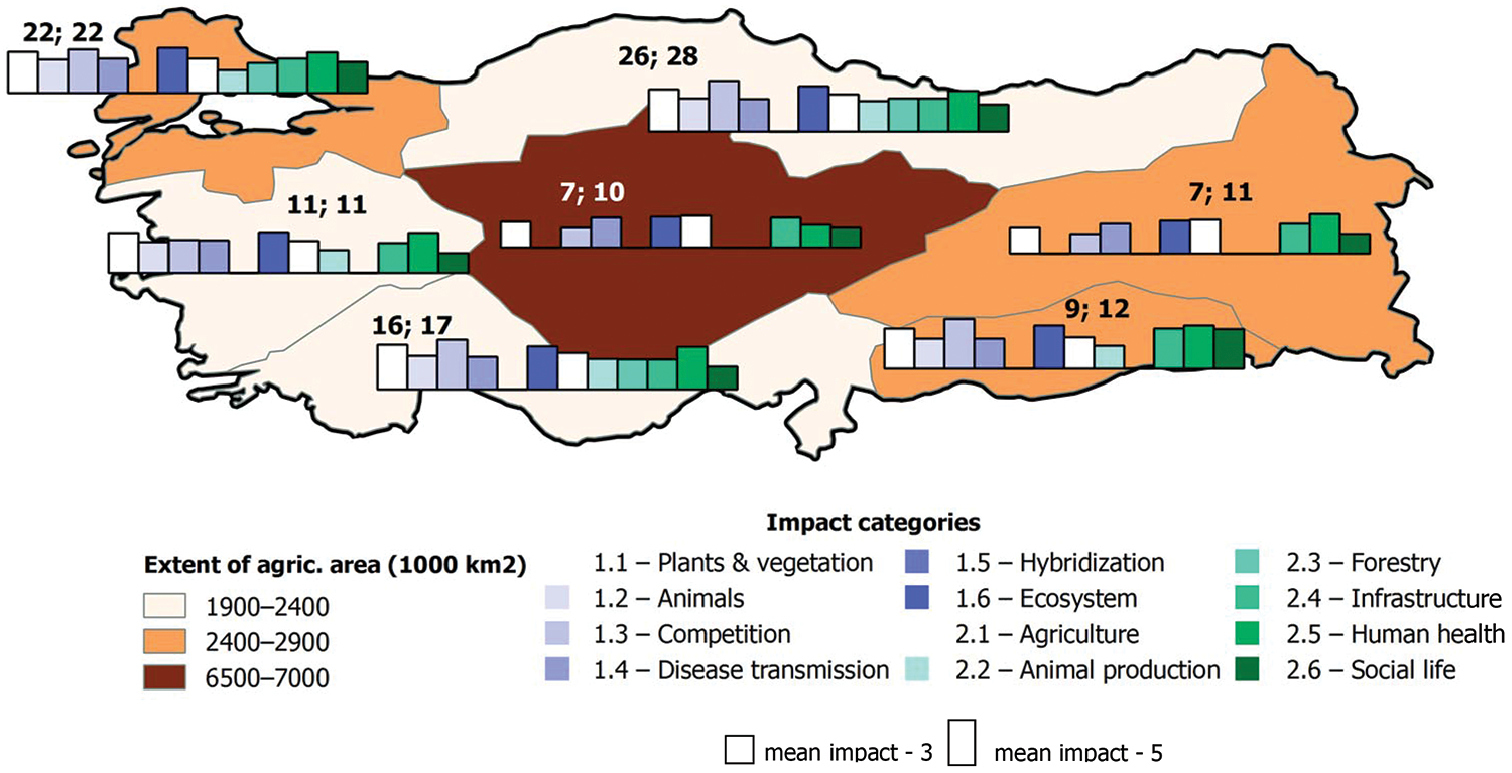
Map of impact types per individual geographical region. Shading of the regions reflects the extent of agricultural area (thousands of km2 in that region; TUIK 2015). The heights of the bars in the main figure are proportional to the assessed impact of alien species in the regions; two bars with mean impacts of 3 and 5 are shown as a reference. Numbers above the bars show the number of species with environmental and socioeconomic impact in the region. |