|
||
|
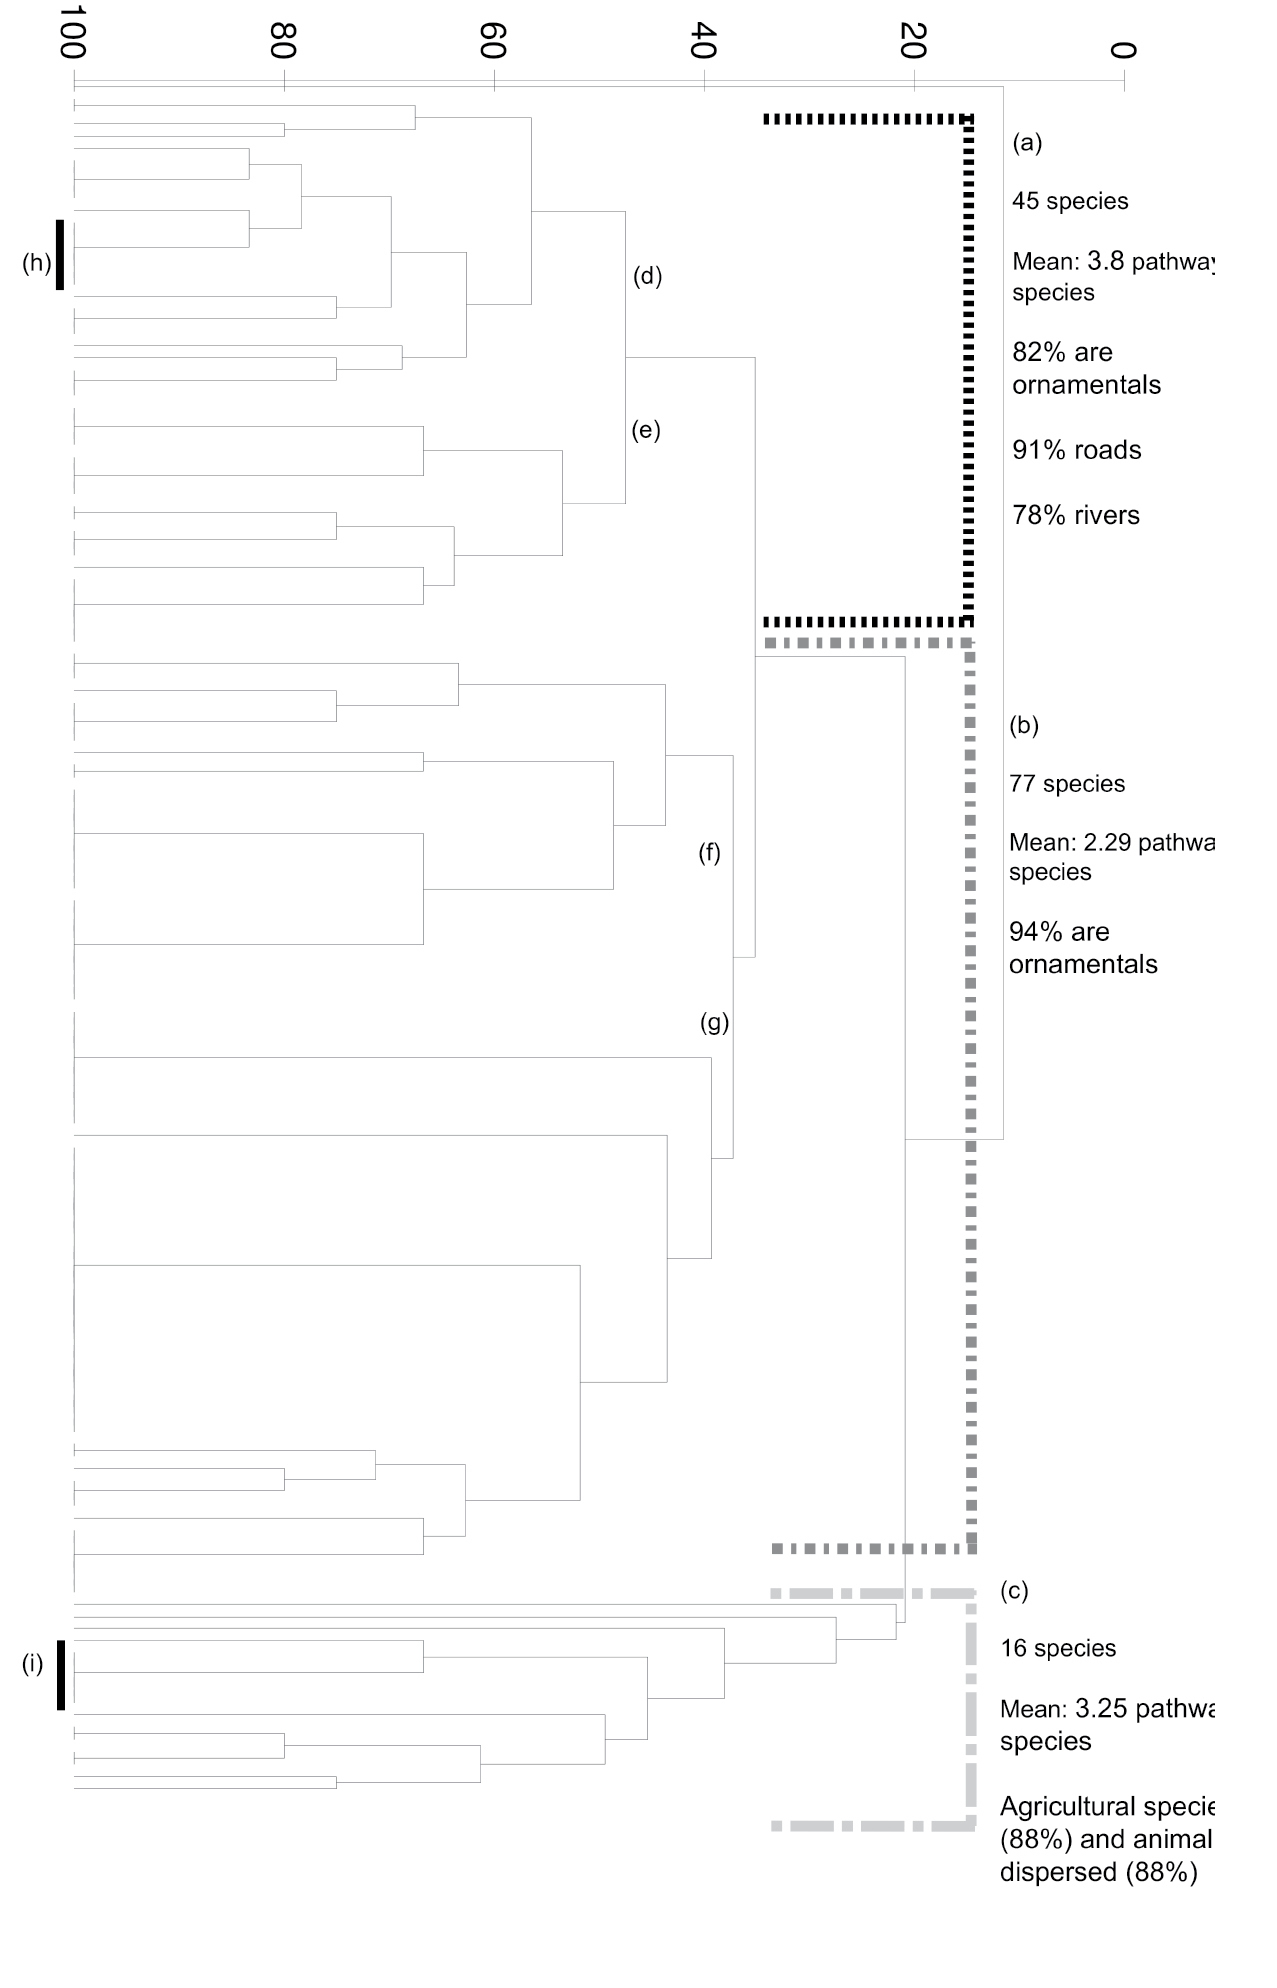
Cladogram of plant introduction pathways, based on similarities of pathways. Mean number and type of pathways have been calculated per clade (Groups a–c). Sub-groups d include 25 species (Mean: 4.5 pathways/species; 100% contaminants; 92% rivers; 84% roads; 80% ornamentals) e include 20 species (Mean: 2.9 pathways/species; 100% roads; 85% ornamentals) f include 29 species (Mean: 2.5 pathways/species; 96% ornamentals; 90% animals) g include 48 species (Mean: 2.1 pathways/species; 91% ornamentals). The vertical black bars indicate clustering of species, whereas all other species are scattered across the groups h Acacia podalyriifolia, A. baileyana, A. elata, A. implexa, A. longifolia i Pinus pinaster, P. radiata, P. roxburghii, P. taeda, P. halepensis, P. patula. |