|
||
|
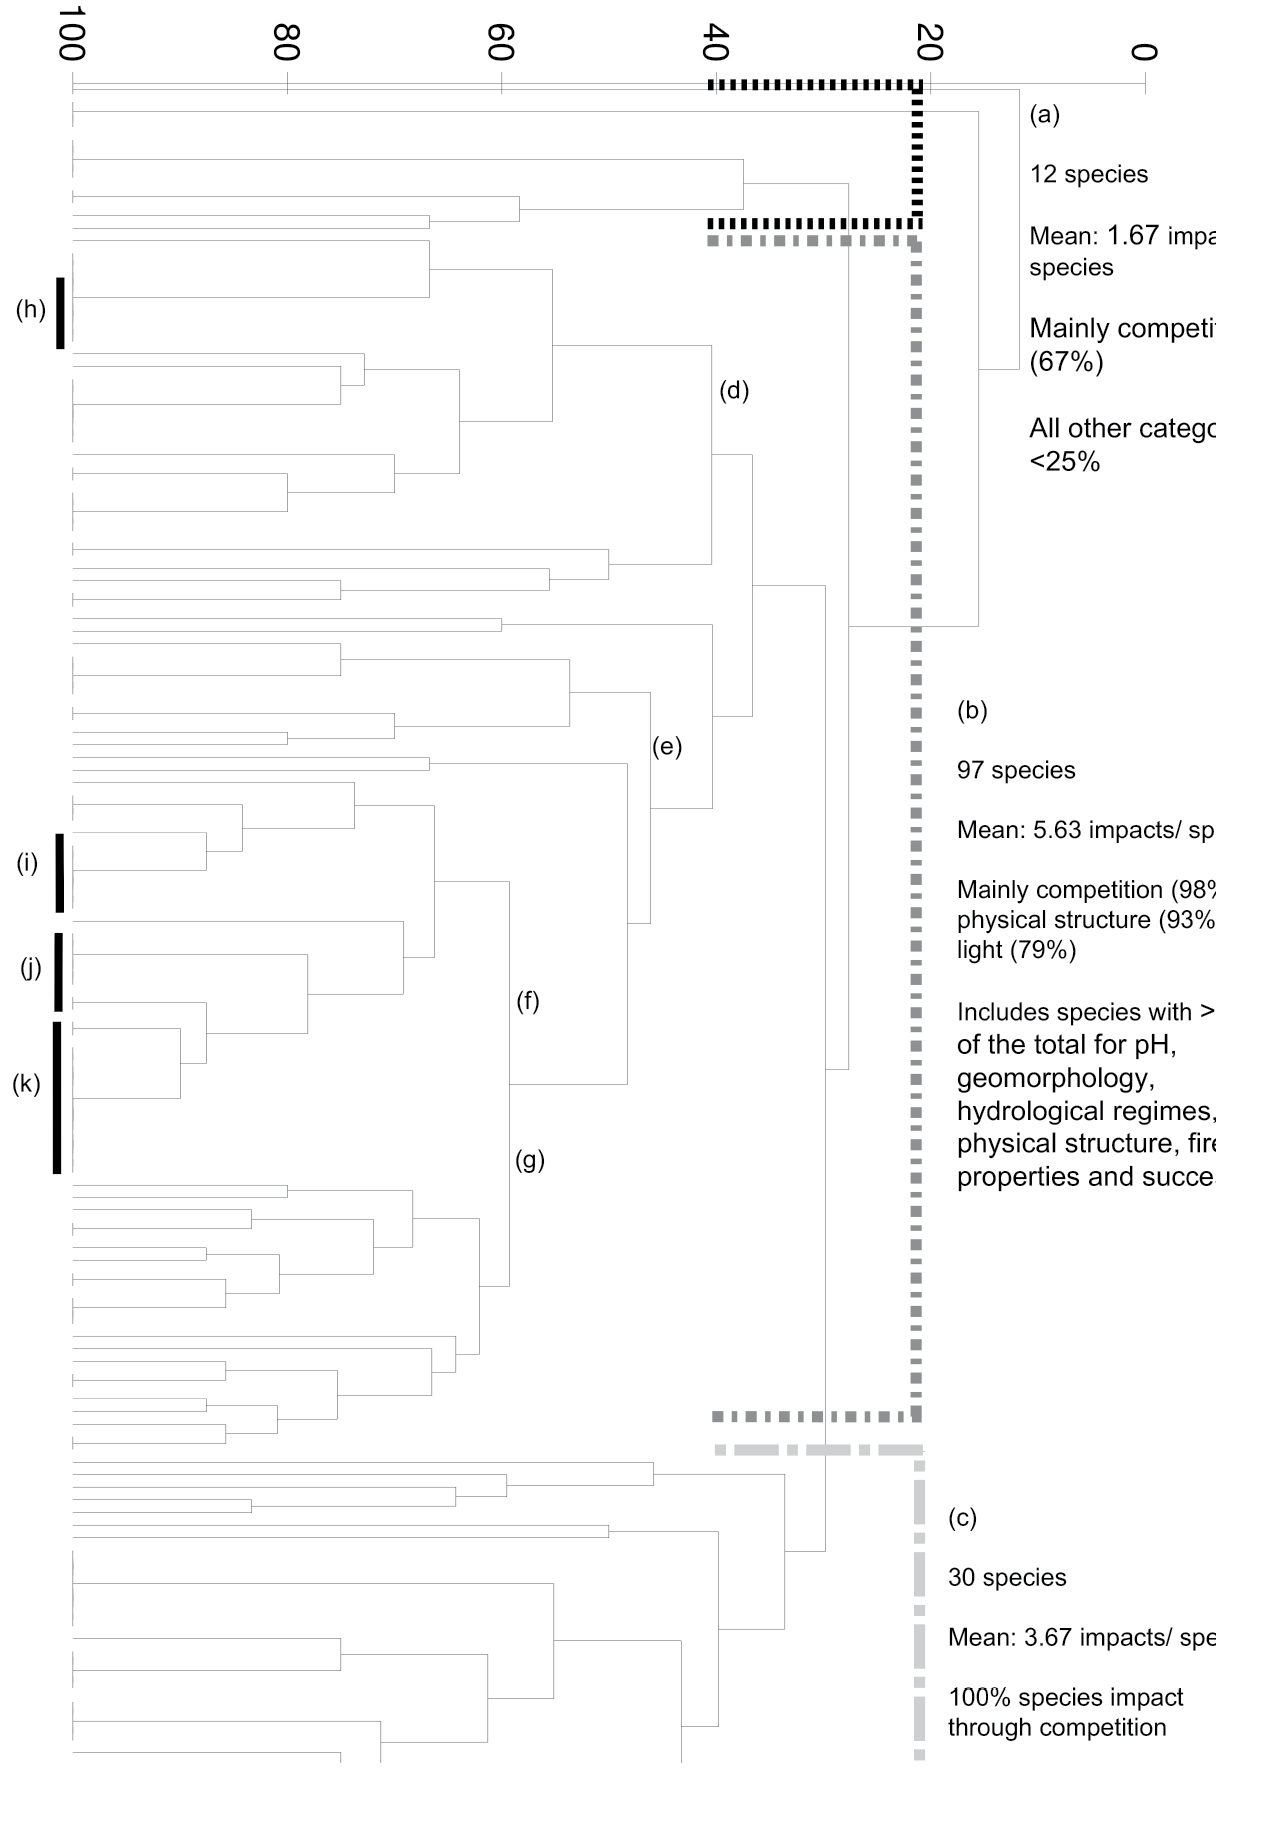
Cladogram of plant impacts, based on similarities of impact types. Mean number and type of impacts have been calculated per clade (Groups a–c). Sub-groups include d 24 species (Mean: 3 impacts/species; 100% competition; physical structure 100%) e 11 species (Mean: 4.6 impacts/species; 100% competition; physical structure 100%; 82% hydrological) f 32 species (Mean: 7.9 impacts/species; competition, physical structure, light, hydrology, fire >90%) g 22 species (Mean: 6.4 impacts/species; competition, physical structure, light, hydrology >90%). The vertical black bars indicate clustering of species, whereas all other species are scattered across the groups h Cereus jamacaru, Echinopsis spachiana, Opuntia aurantiaca, O. ficus-indica, O. humifusa, Cylindropuntia imbricata, C. fulgida, Opuntia stricta i Eucalyptus cladocalyx, E. lehmannii, E. sideroxylon, E. camaldulensis, E. diversicolor j Pinus radiata, P. roxburghii, P. taeda, P. halepensis, P. patula, P. canariensis, P. pinaster k Acacia dealbata, A. mearnsii, A. melanoxylon, A. paradoxa, A. podalyriifolia, A. pycnantha, A. saligna, A. baileyana, A. cyclops, A. decurrens, A. elata, A. implexa, A. longifolia. |