|
||
|
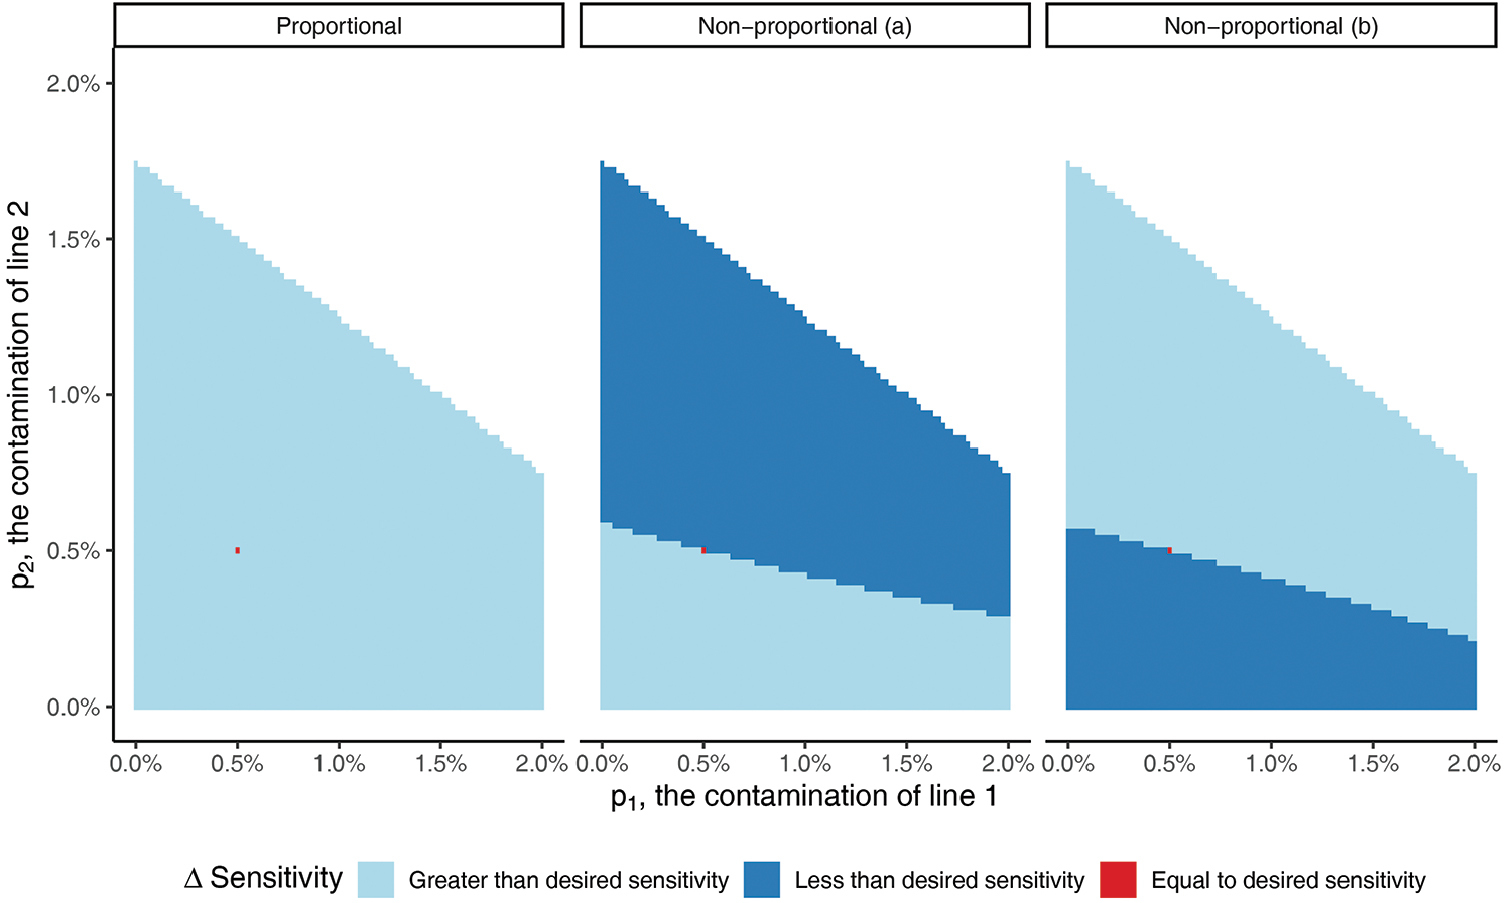
Difference in achieved sensitivity under three different sampling situations. The values plotted show the regions of obtained sensitivities that are greater than or less than the desired sensitivity. |
|
||||||||
| Part of: Lane SE, Cannon RM, Arthur AD, Robinson AP (2019) Sample size for inspection intended to manage risk within mixed consignments. NeoBiota 42: 59-69. https://doi.org/10.3897/neobiota.42.29757 |