|
||
|
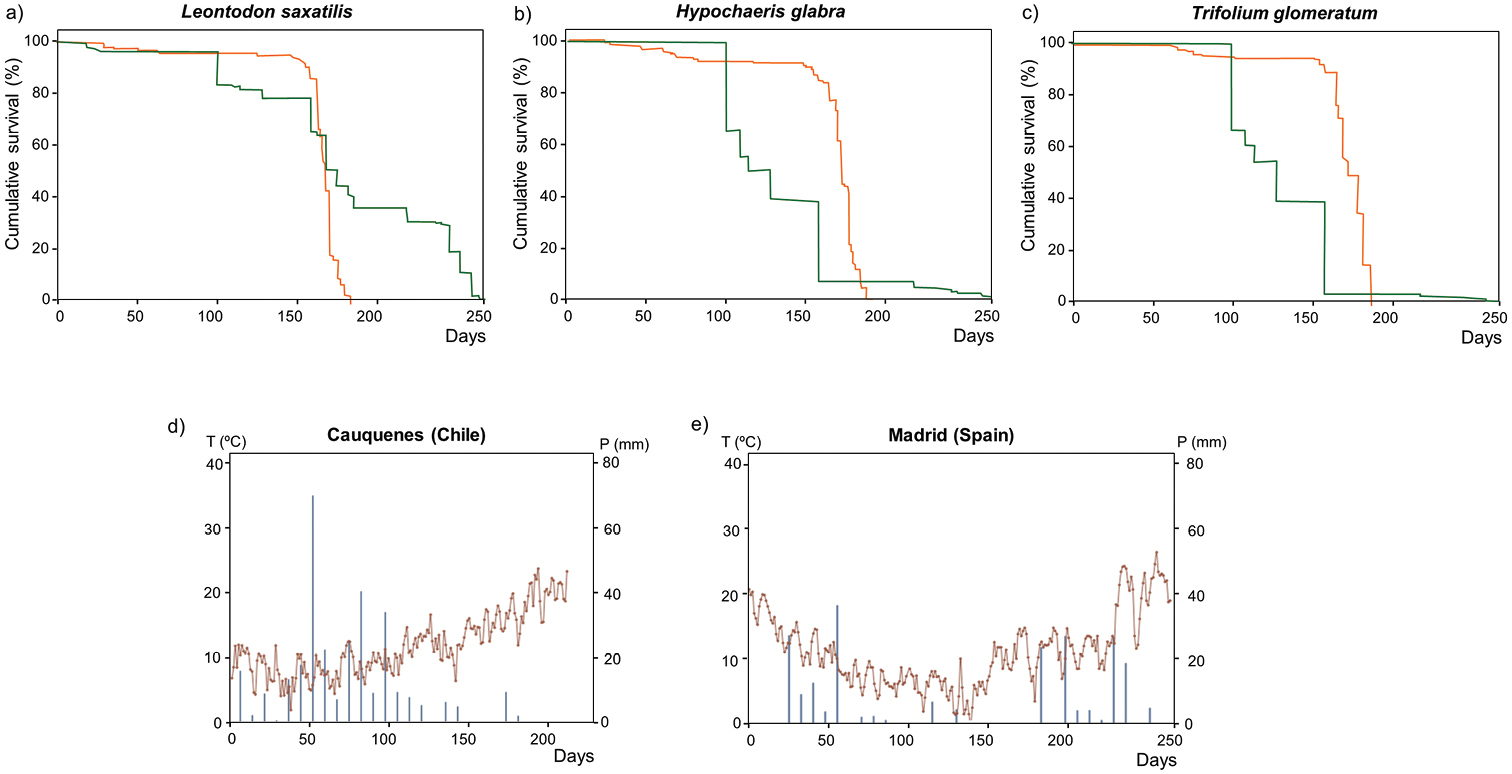
Kaplan-Meier survival curves for Leontodon saxatilis (a), Hypochaeris glabra (b) and Trifolium glomeratum (c) in trials at both the native (green line) and the introduced ranges (orange line). Daily medium temperature values (°C) during the experiment are shown with a continuous brown line, while precipitation (mm/week) is represented by blue bars for both the common garden at the introduced range (d) and the common garden at the native range (e). |