|
||
|
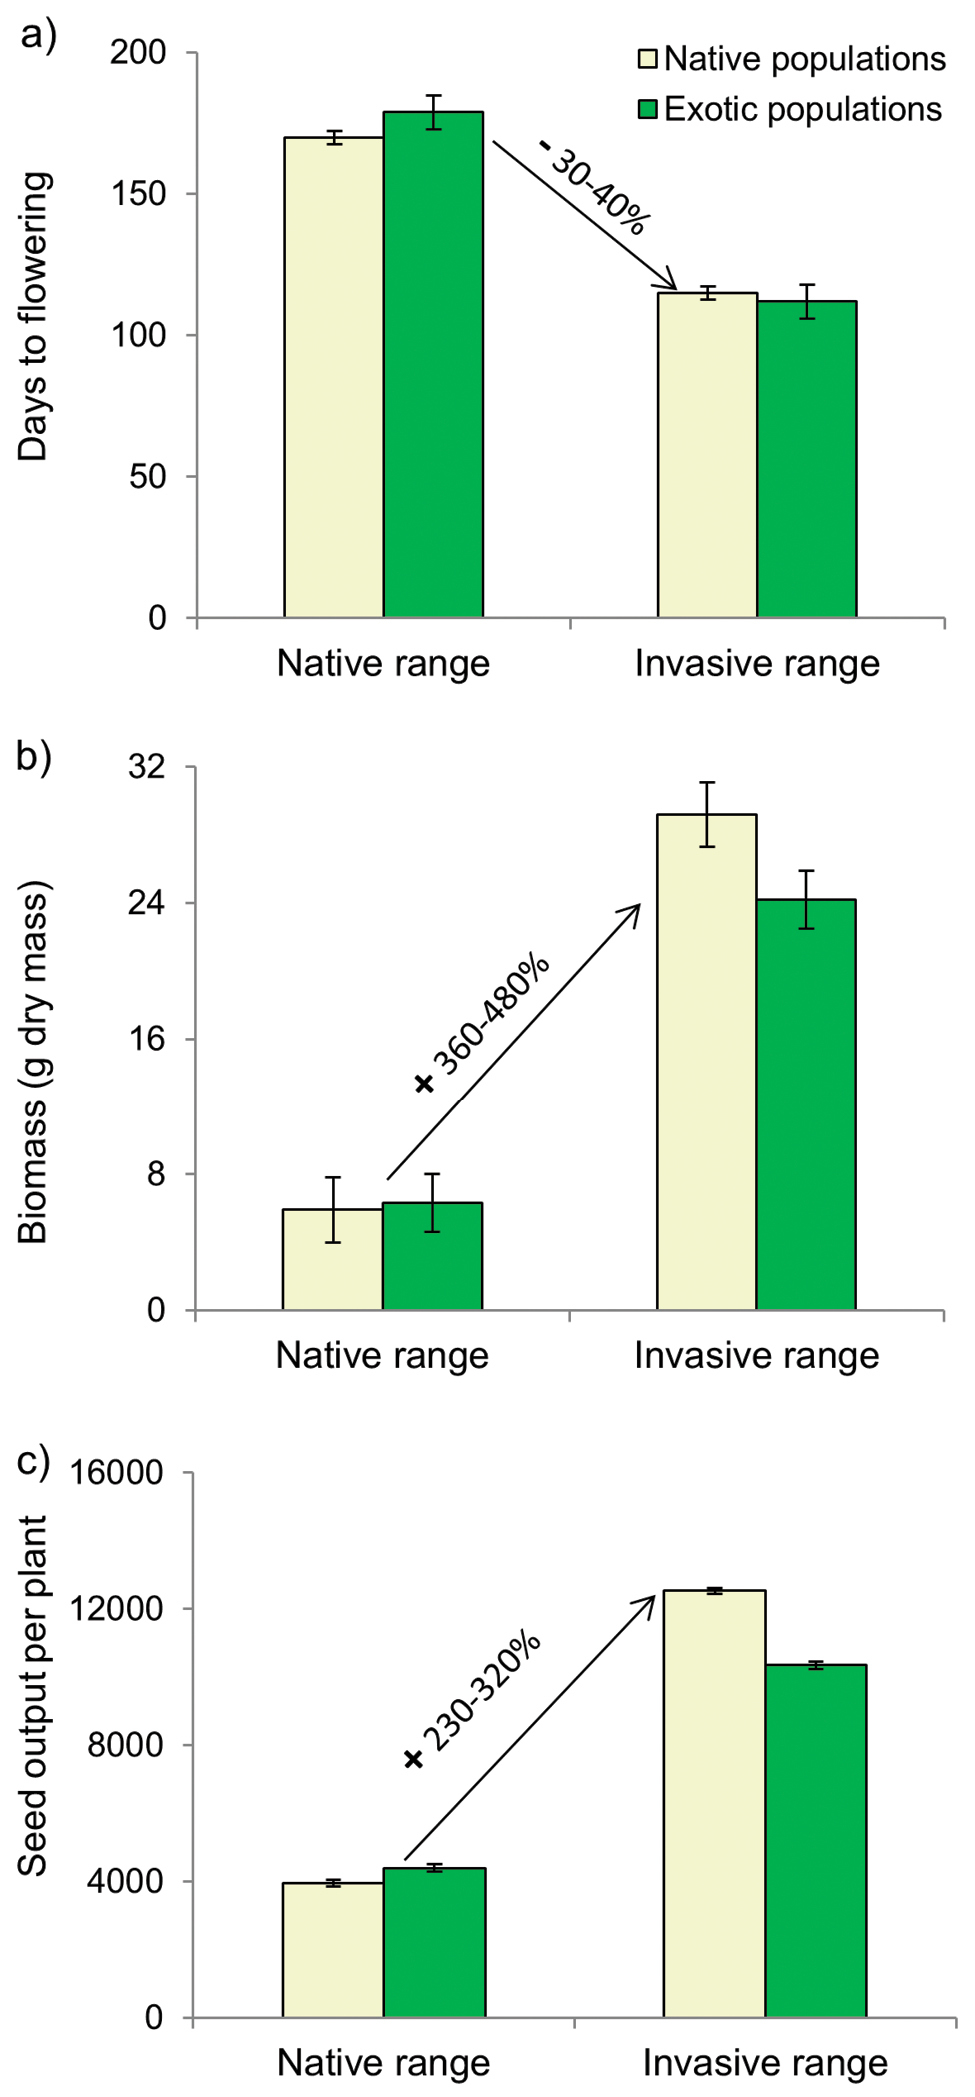
Comparisons between trials at the native and the introduced ranges for native and exotic populations of Leontodon saxatilis. Graphs show mean values and standard errors of days to flowering (a), biomass per plant (b) and seed output per plant (c) grouped by origin of the population. Percentages of variation between the native trial and the invasive one are also shown. The arrow indicates the direction of the colonisation process, from the source to the recipient region. |