|
||
|
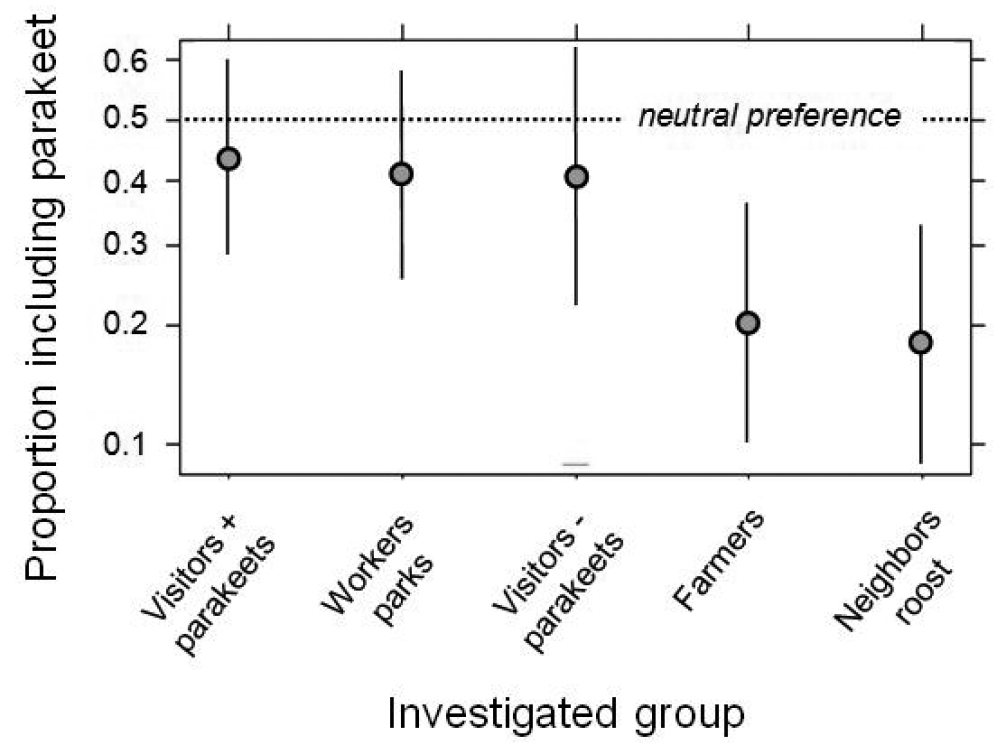
Differences amongst people in their response towards parakeets. Proportion of individuals per pre-defined survey group that included the parakeet into their list of 10 preferred birds, ordered from high to low (and corrected for all variables included in the statistical analysis, see Table 1). Since people could choose 10 out of 20 birds on offer, a neutral preference would result in a 50% probability of inclusion (dotted line). |