|
||
|
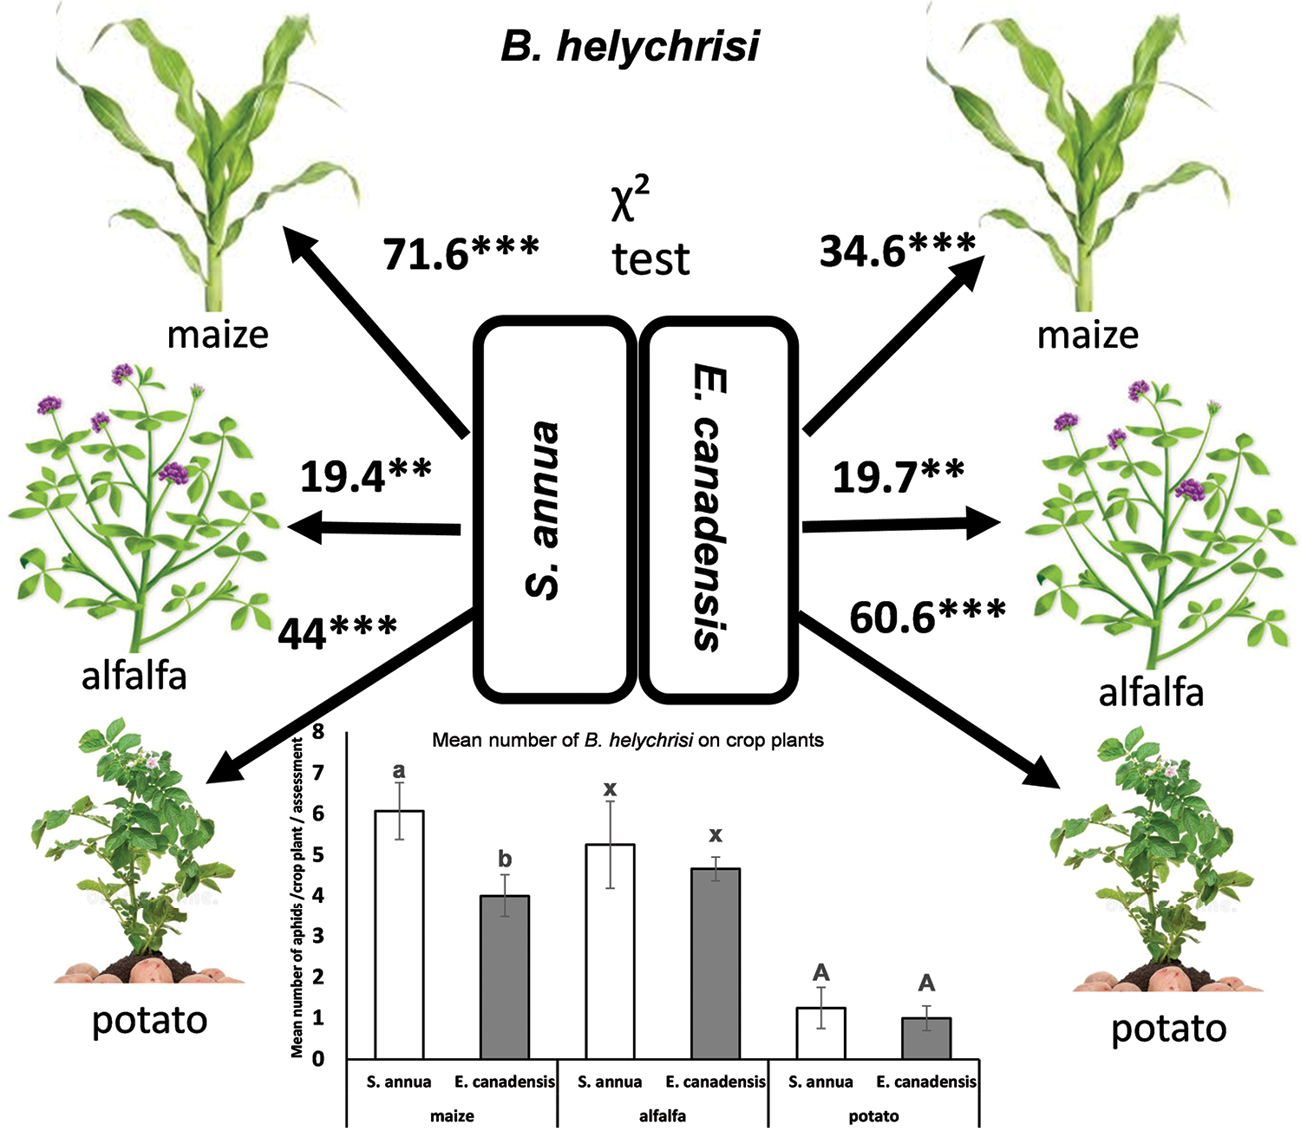
Comparison between colonization rate of B. helichrysi from E. canadensis and S. annua towards each crop plant (maize, potato and alfalfa). The average number of aphids / plots / plants / sampling data were considered. Interactions were then compared using χ² tests on the differences between the covariance matrices, and by the root mean square error of approximation. Numbers represent χ2-values for significant path coefficients. **P < 0.01, ***P < 0.001. Bar chart represent comparison between aphids densities found on crop plants (maize, potato and alfalfa) when these were set in blocks with E. canadensis or S. annua. To compare variables, t-tests were used. Different letters indicate statistical significant differences at P < 0.01 level. Error bars = ±1 standard error. |