|
||
|
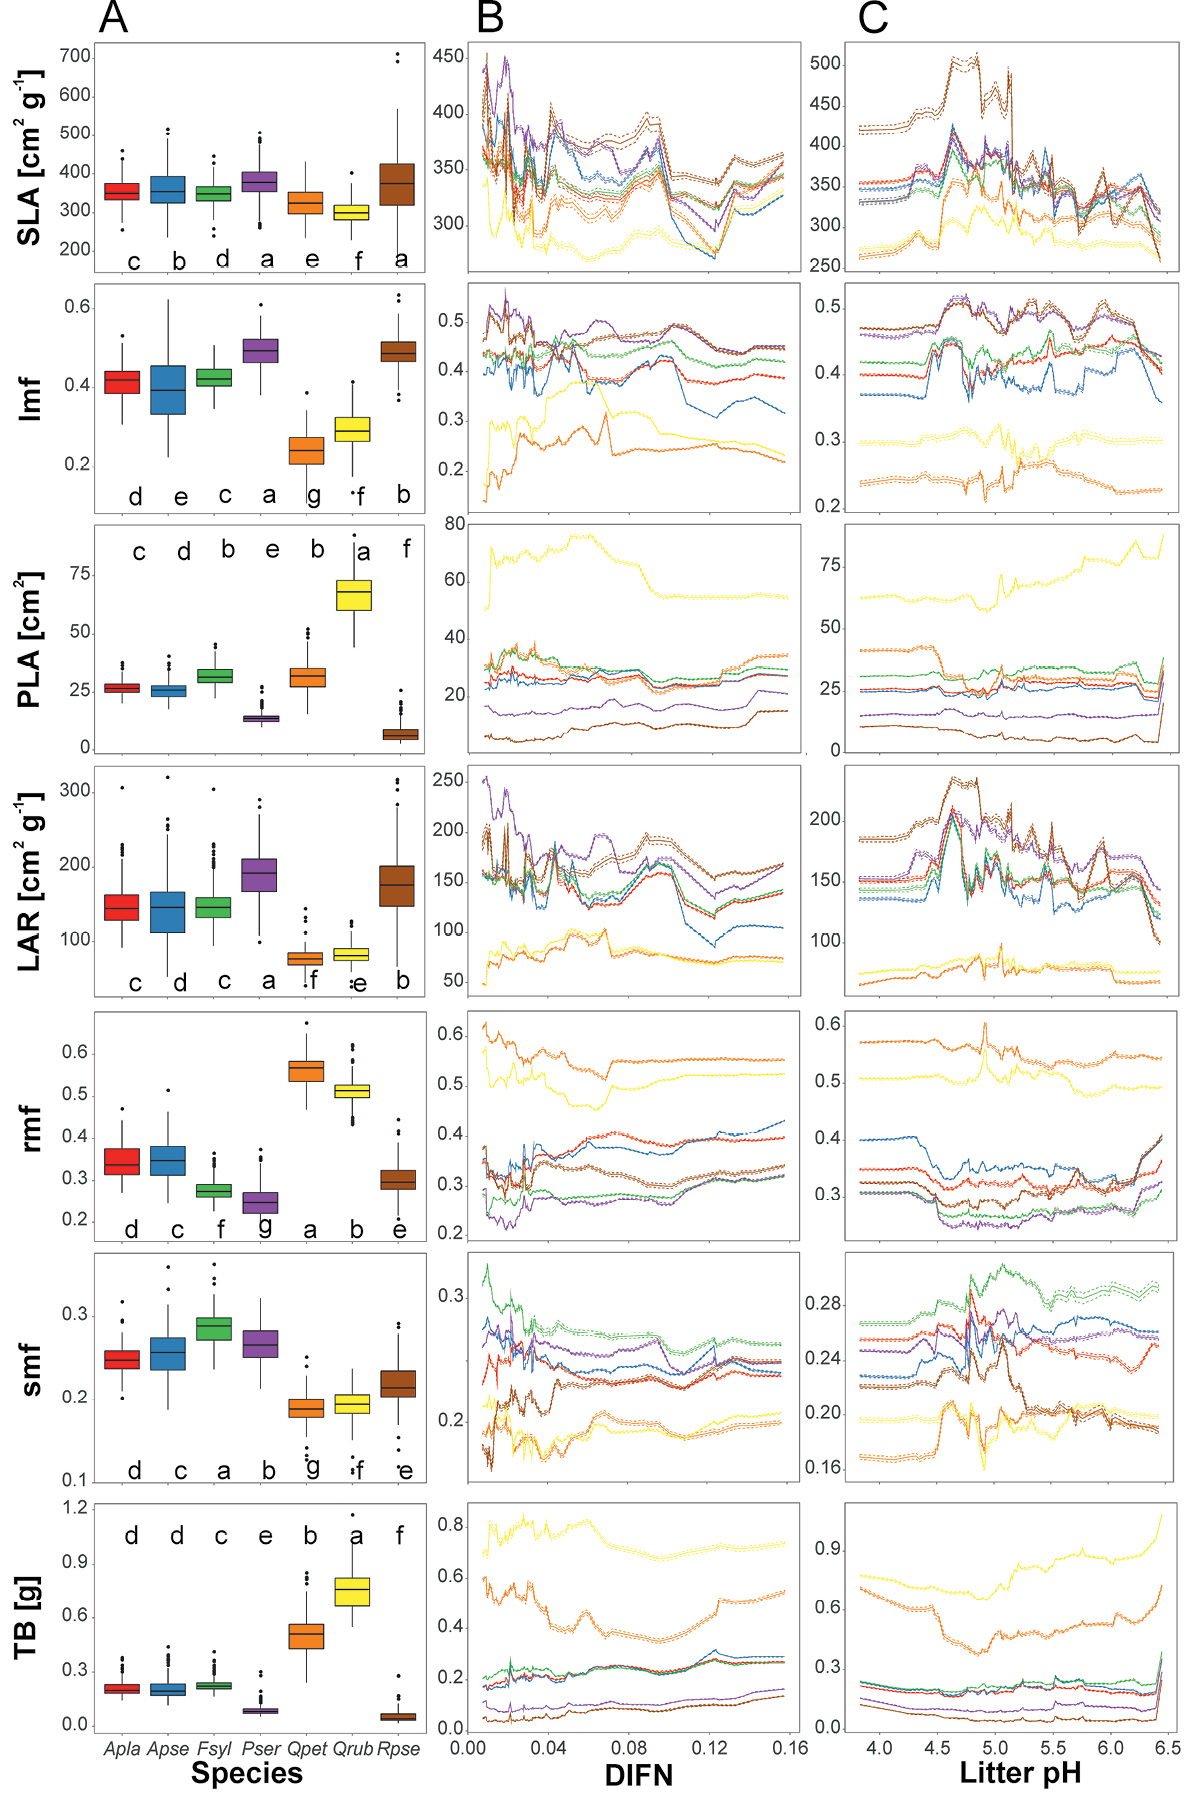
Saplings traits variability of the species studied across predictors explained by a random forest model. Partial dependence plots (ceteris paribus plots) show changes of predicted values when a particular predictor is changed while all remaining predictors are constant (i.e. mean value) – in the middle (B) and right (C) column we showed interactions between species and DIFN and litter pH. In the left column (A) we showed partial group predictions – predicted trait values assuming constant levels of other predictors, boxes represent interquartile range and median, whiskers represent minimum-maximum range, abbreviations of species: Apla – Acer platanoides, Apse – A. pseudoplatanus, Fsyl – Fagus sylvatica, Pser – Prunus serotina, Qpet – Quercus petraea, Qrub – Q. rubra, Rpse – Robinia pseudoacacia; traits: SLA – specific leaf area, lmf – leaf mass fraction, PLA – projected leaf area, LAR – leaf area ratio, rmf – root mass fraction, smf – stem mass fraction, TB – total biomass. For further details see Table 1. Species marked by the same letter did not exhibit significant statistical difference in predicted trait values, according to the Tukey posteriori test at p=0.05. |