|
||
|
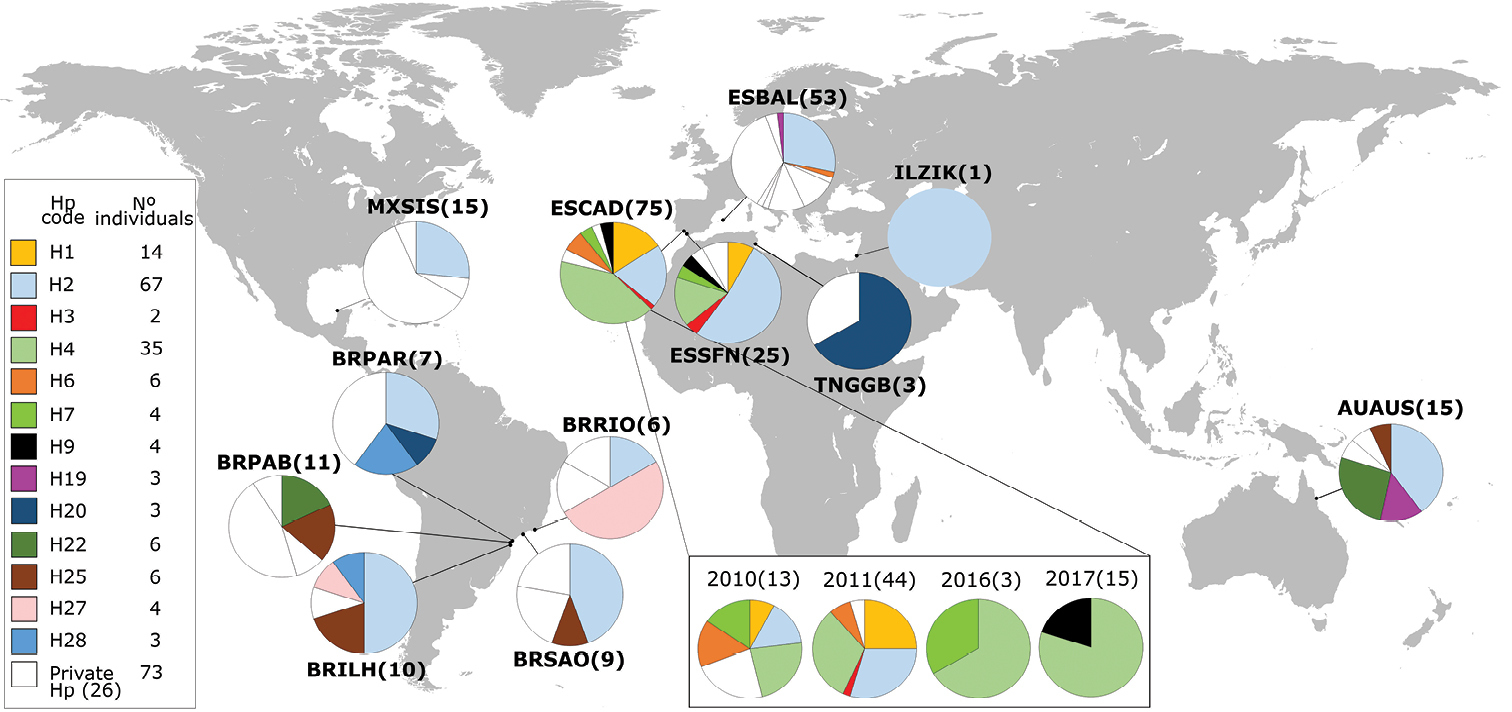
Geographical distribution of the 39 mtDNA haplotypes (Hp) of Paracaprella pusilla in the populations sampled. Each site is represented by a pie chart showing population composition and relative haplotype frequency. Number of analysed individuals per population appears in brackets. White-shaded areas are the cumulative proportion of private haplotypes per location. Sites are coded as in Tables 1 and 2. The legend gives information about the existing haplotypes across all locations and the number of individuals carrying each haplotype. For the Cadiz marina (ESCAD) population, the change in haplotype frequency is shown in the four years when the species was recorded. |