|
||
|
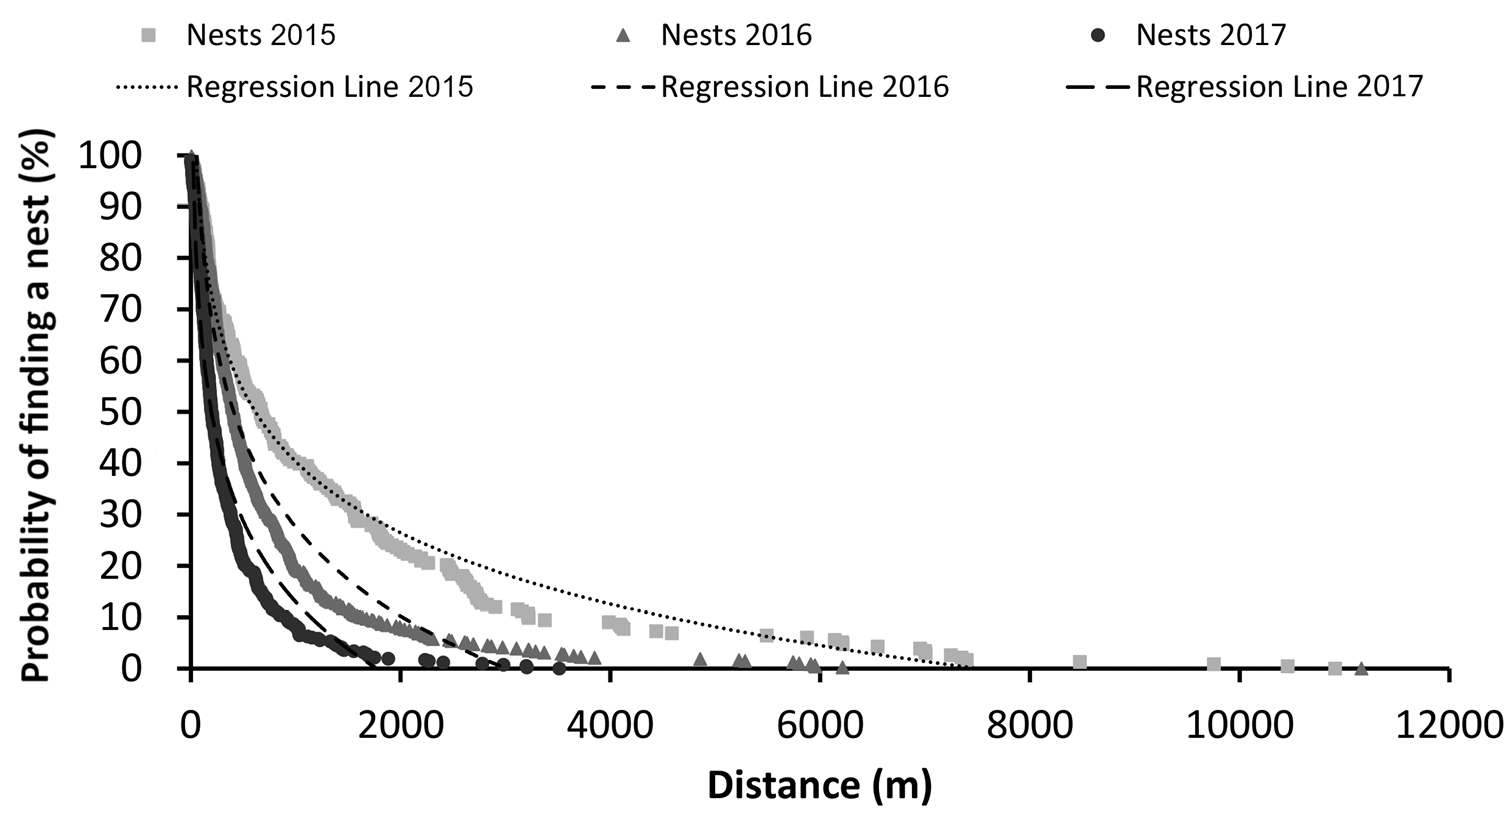
Nests distances from source of diffusion of the previous years: the distance of nests from a possible source of diffusion is given on the x-axis, while the probabilities to find a nest on the y-axis. The lines represent the logarithmic regression models of the data (regression line 2015: y = -0.2 ln (x) + 1.785; R2 = 0.97; regression line 2016: y = -0.25 ln (x) + 2.0057; R2 = 0.94; regression line 2017: y = -0.227 ln (x) + 1.6967; R2 = 0.92). |