|
||
|
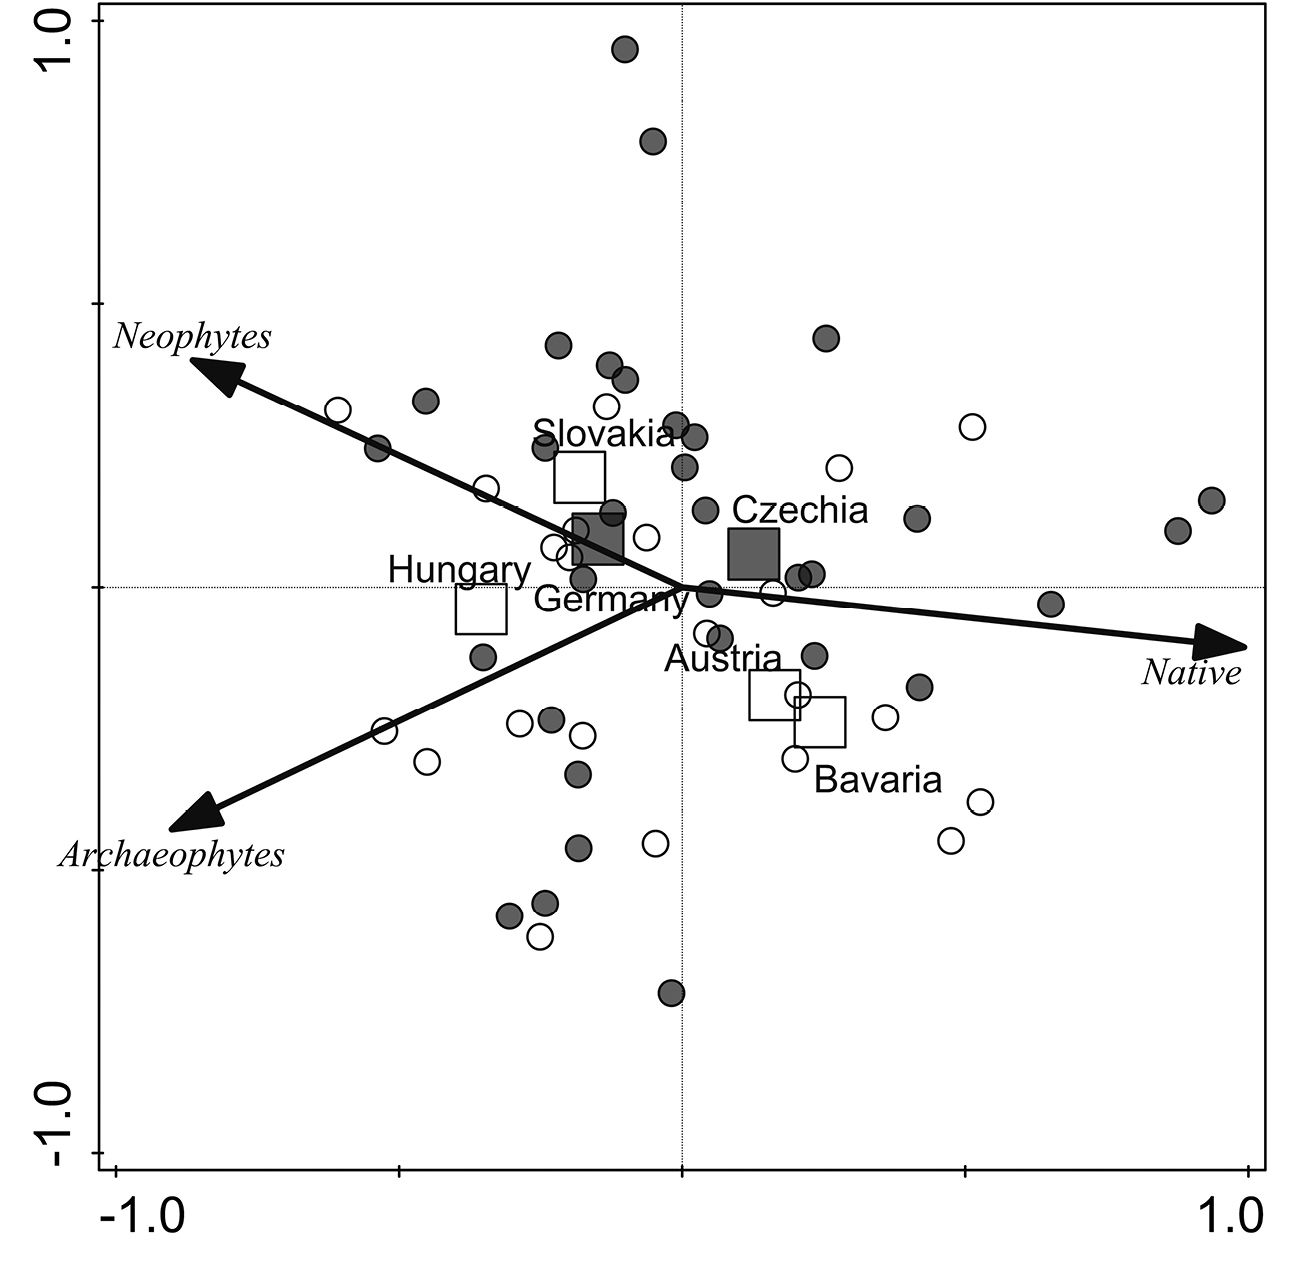
Ordination diagram (PCA) of proportion of the number of alien and native species in the river ports. The first two axes explain 99% of the total variation, individual regions account for 33% of variation. Circles = ports, squares = countries; closed symbols = ports and regions on the Elbe-Vltava waterway; open symbols = ports and regions on the Danube waterway. |