|
||
|
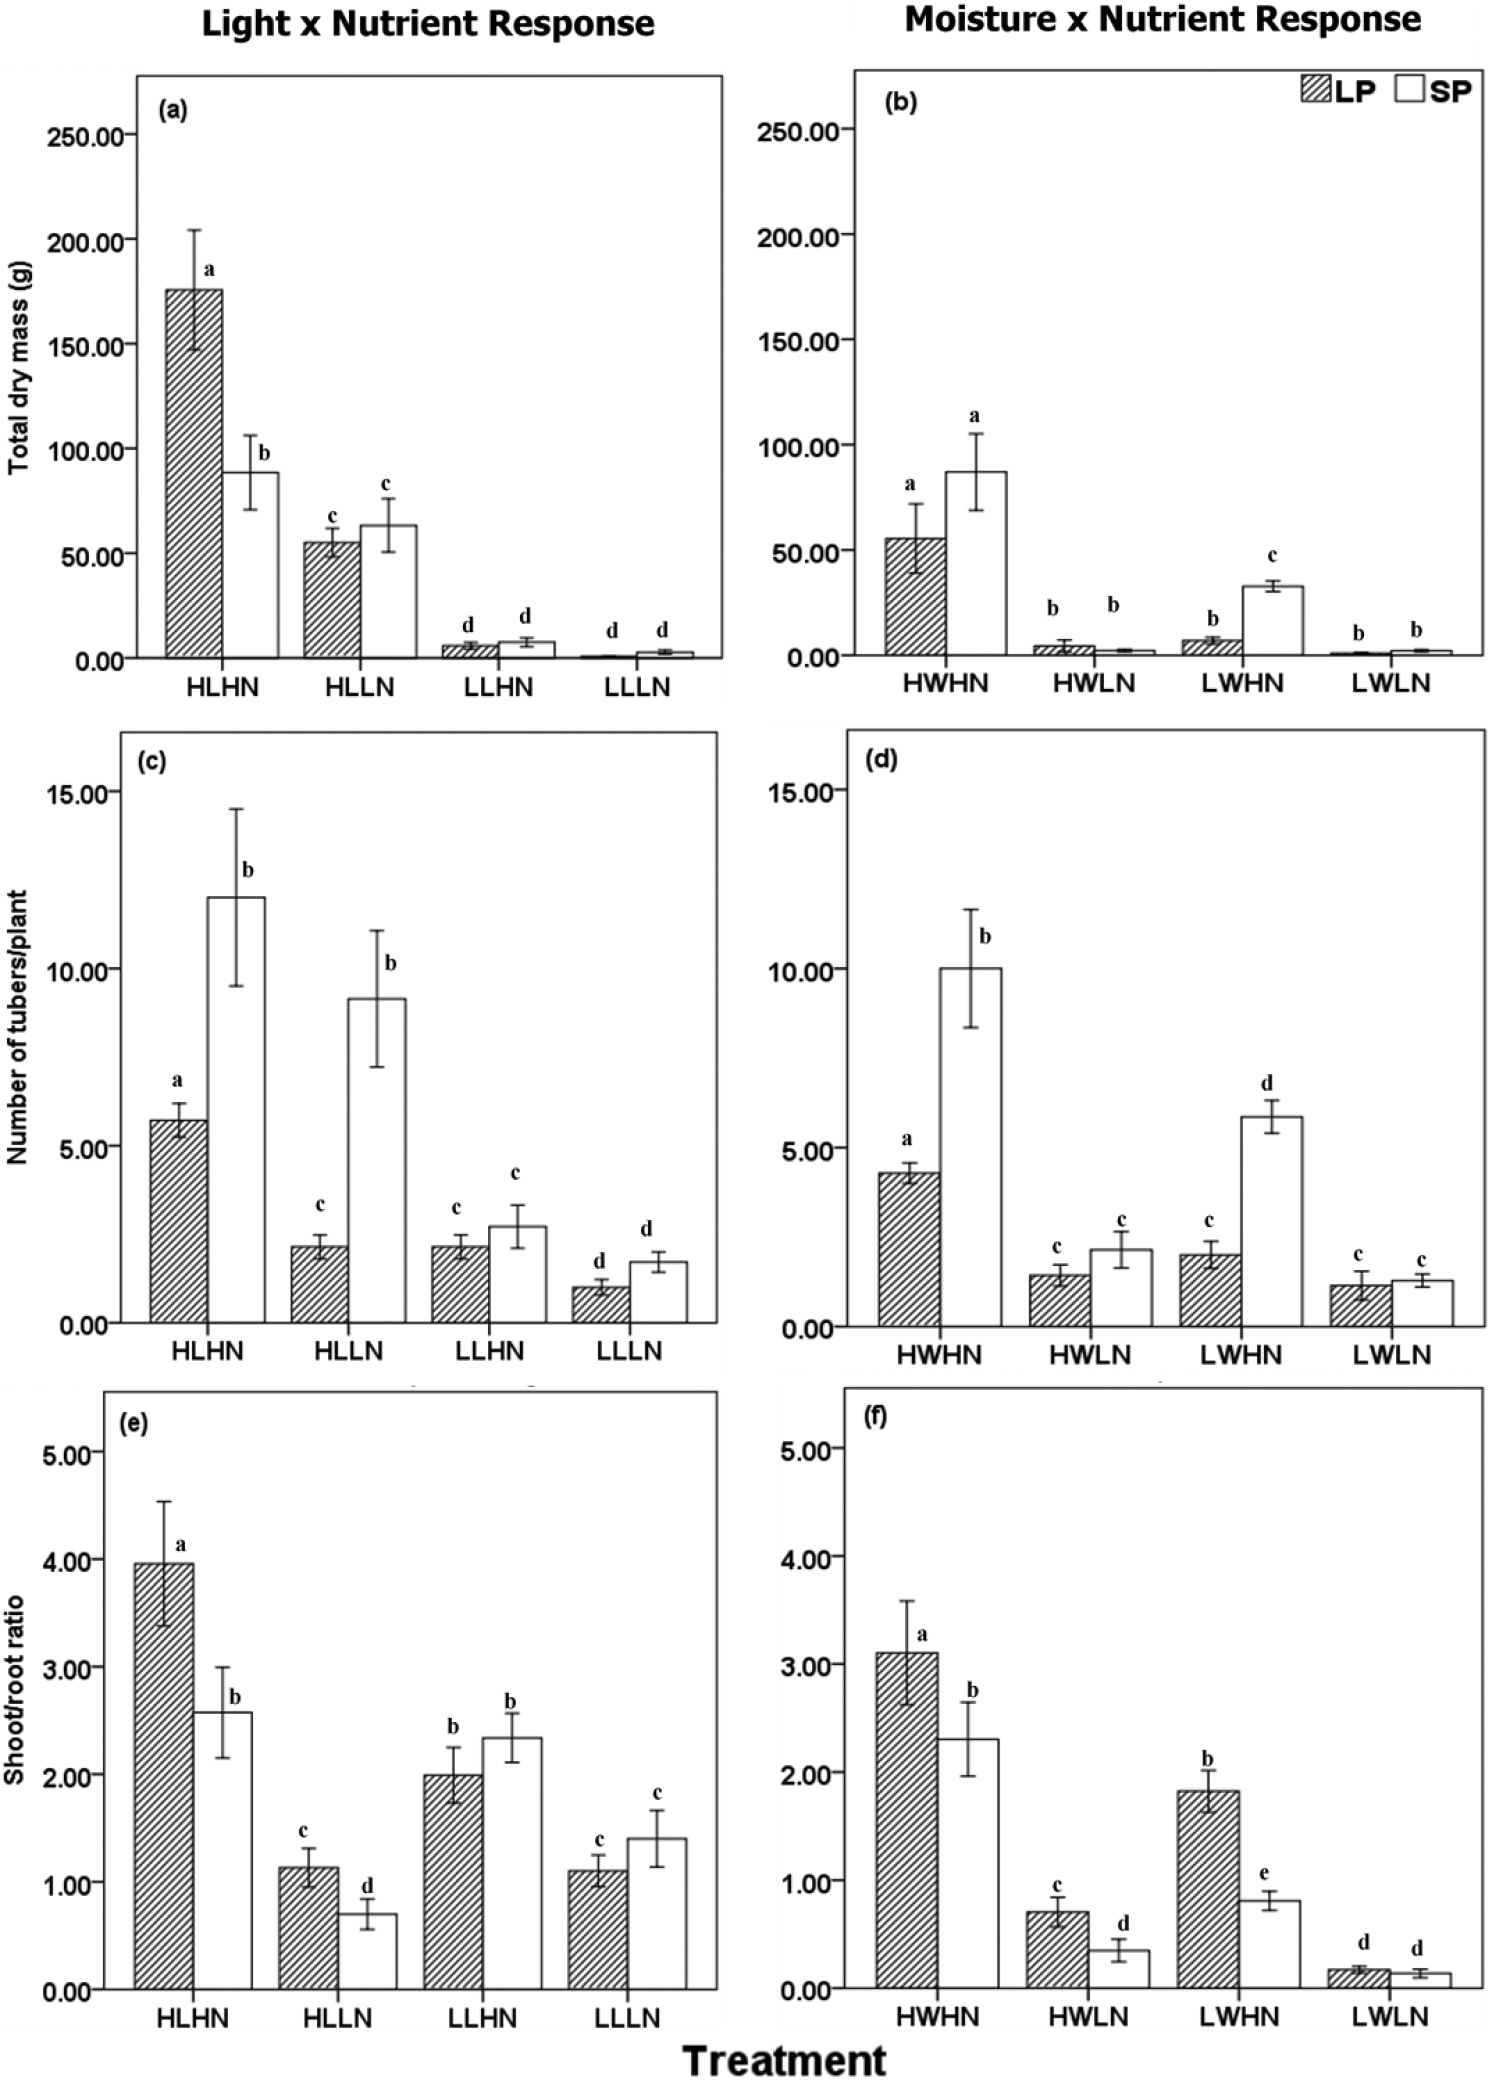
Trait response of the LP and SP forms to varying levels of light, water and nutrient conditions. Total biomass accumulated (a, b); Average number of tubers per plant (c, d); Shoot/root ratio (e, f). The legend in the graph (b) applies to all graphs. Graphs on the left (a, c, e) show traits responses to light x nutrient experiments and those on the right (b, d, f) show trait responses to water x nutrients experiments. Bars represent standard error of the mean (SEM). Differences across treatments are denoted by letters. |