|
||
|
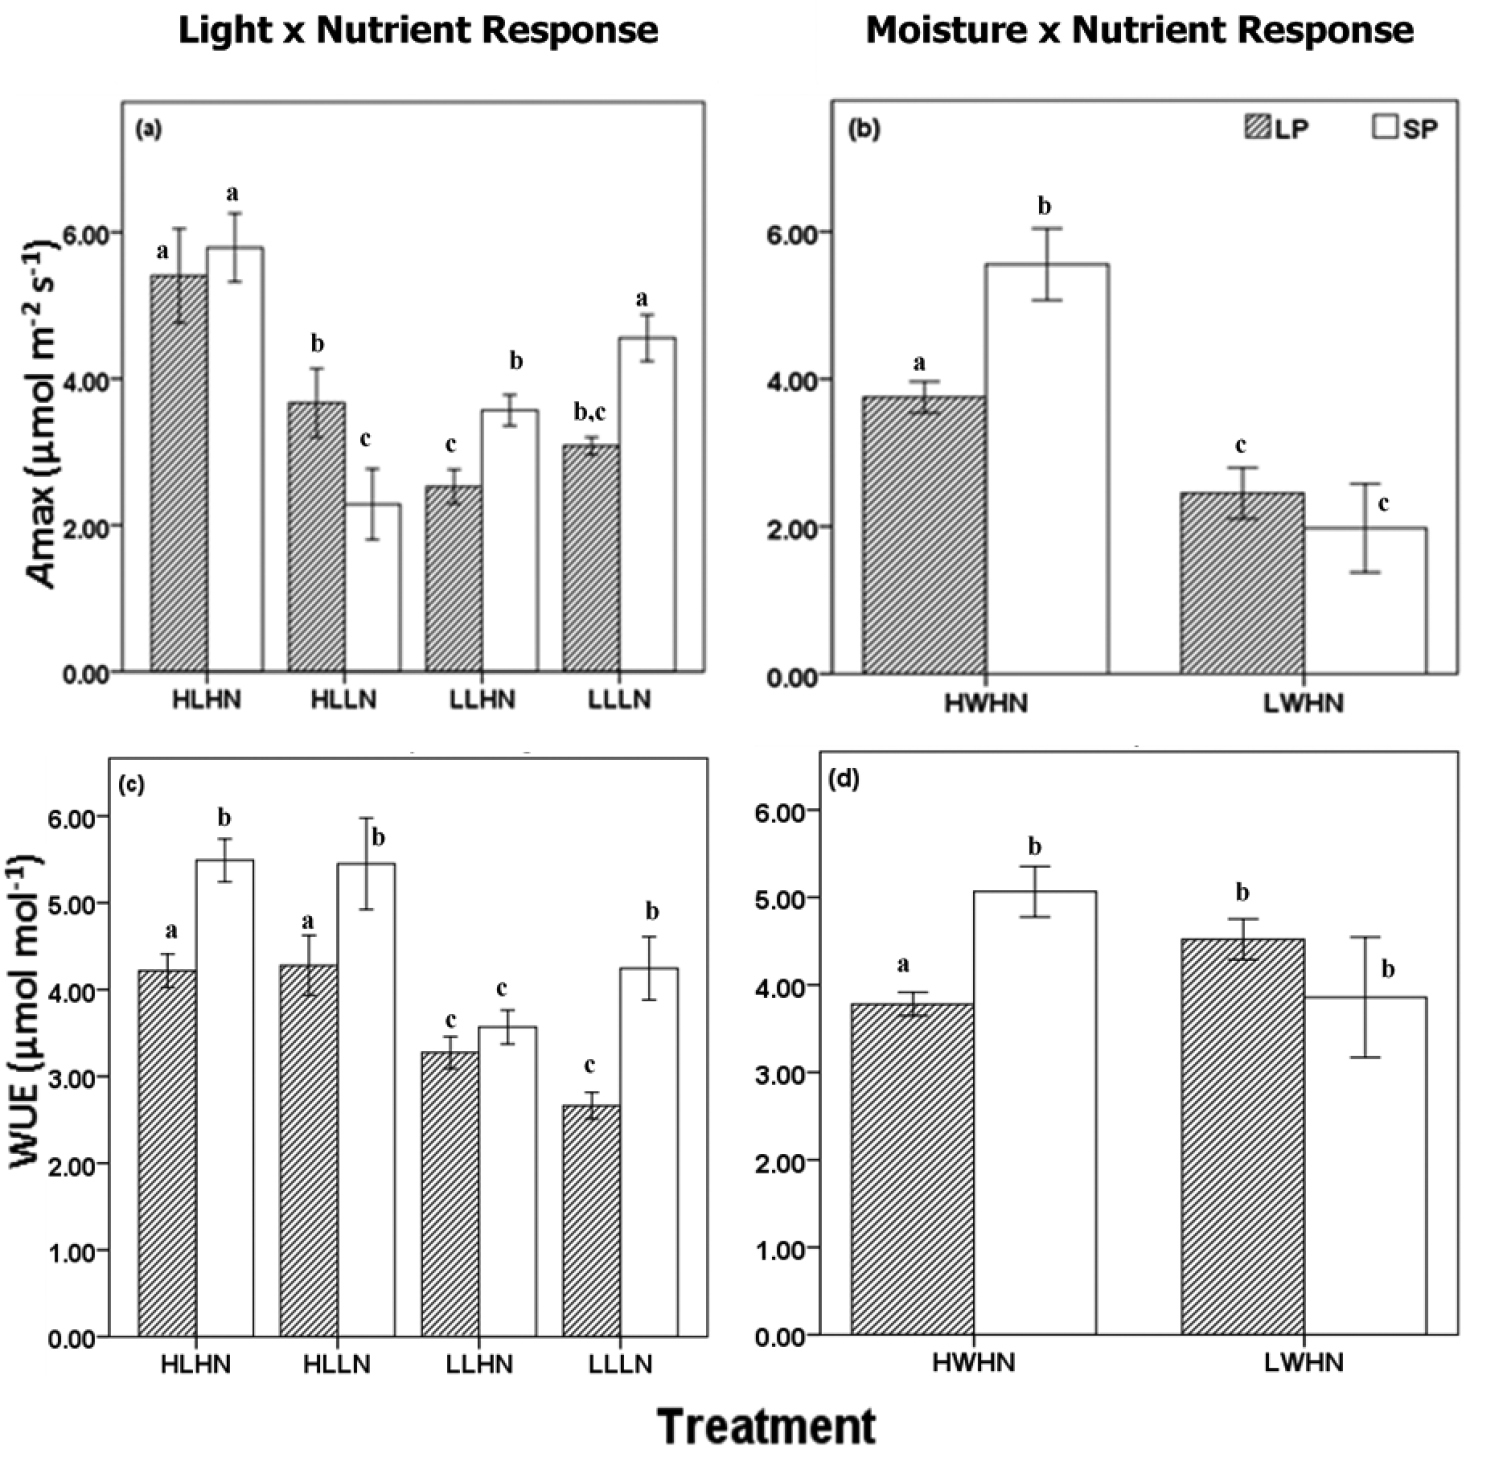
Carbon assimilation rates and water use efficiency of the LP and SP forms in response to light, water and nutrient resources. Maximum carbon assimilation, Amax (a, b); water use efficiency, WUE (c, d). The legend in the graph b applies to all graphs. Graphs on the left (a, c) show traits responses to light x nutrient experiments and those on the right (b, d) show trait responses to water x nutrients experiments. Bars represent standard error of the mean (SEM). Differences across treatments are denoted by letters. |