|
||
|
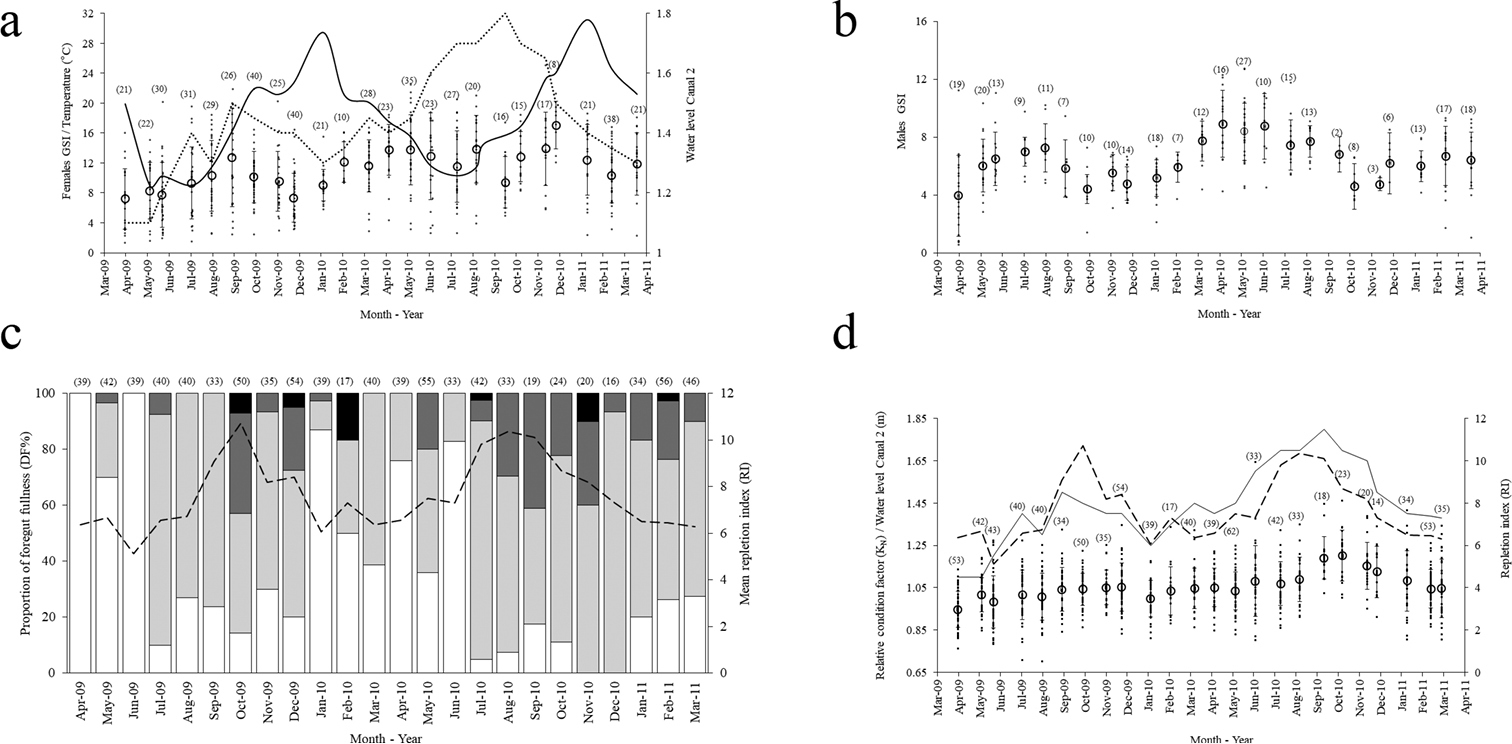
a Monthly changes in female GSI of C. carpio, presenting observed values (circles), mean (big circles) and standard deviations together with temperature (continuous line) and water level (dotted line). Numbers above (in parentheses) refer to the number of analyzed individuals in each month b Monthly changes in male GSI of C. carpio, presenting observed values (circles), mean (big circles) and standard deviations. Numbers above (in parentheses) refer to the number of analyzed individuals in each month c Monthly degree of fullness proportion (DF%) of C. carpio: white bar = 0 (empty), light grey bar = 1 (1/3 full), dark grey bar = 2 (2/3 full) and black bar = 3 (full); average monthly repletion index (RI) (dotted line). Numbers above bars (in parentheses) refer to the number of C. carpio analysed in each month for RI d Monthly changes in KN of C. carpio, showing observed values (circles), mean (big circles) and standard deviations; water level variation in Canal Dos (continuous line) and the repletion index (RI) (dotted line). Numbers above (in parentheses) refer to the number of specimens analyzed every month. |