|
||
|
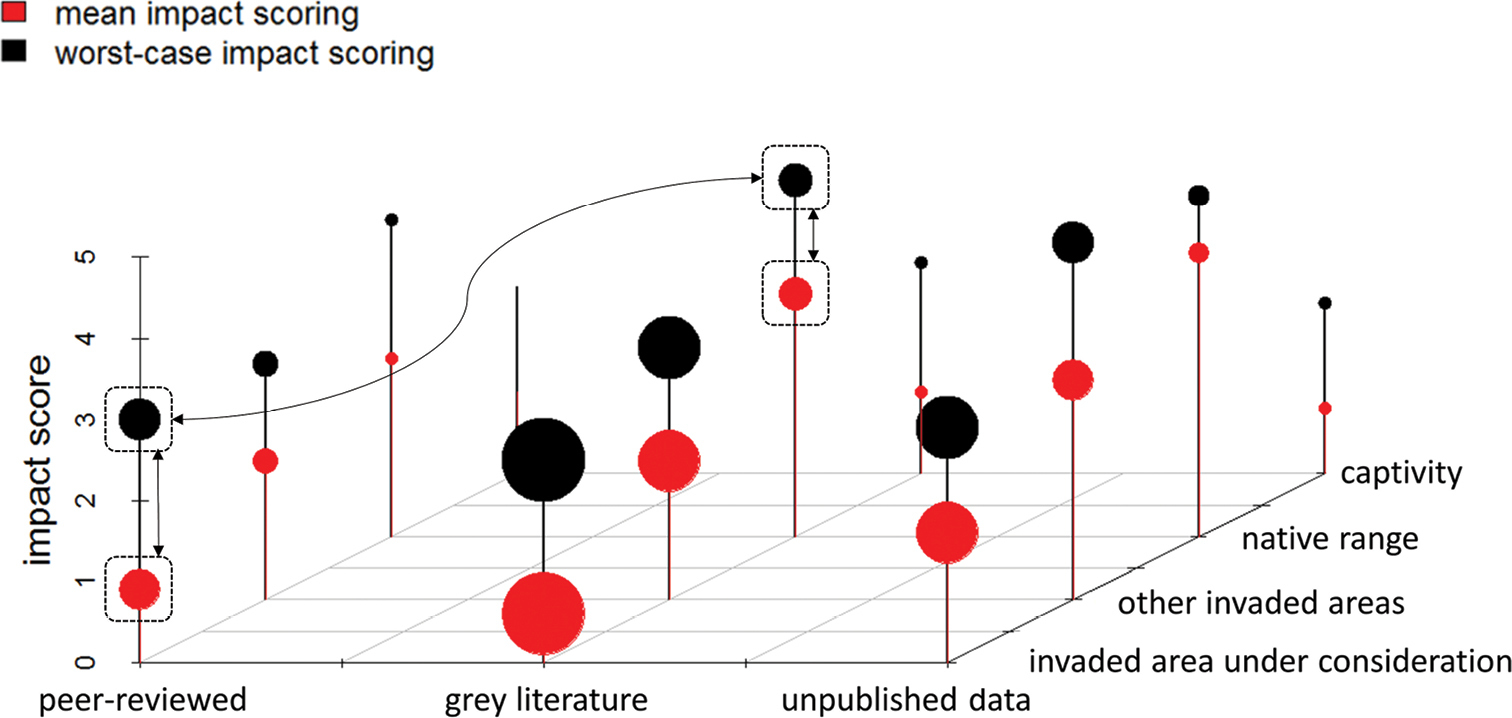
Hypothetical example of an impact assessment carried out following the evidence mapping framework presented here. The figure shows how impact evidence can differ across dimensions, and that consequently, in- or excluding certain classes of evidence (and how they are scored) can strongly change impact assessment final outcomes. The size of the dots is proportional to the number of impacts reported in the literature. In this hypothetical example, including impact evidence from native-range grey literature would result in the species under consideration being assigned a far higher threat level compared to only considering peer-reviewed studies from the invaded area under consideration. Ranking NNS based on their threat level can be done either by averaging impact scores across impact categories (‘mean impact scoring’), or based solely on the most severe impact recorded (‘worst-case impact scoring’). |