|
||
|
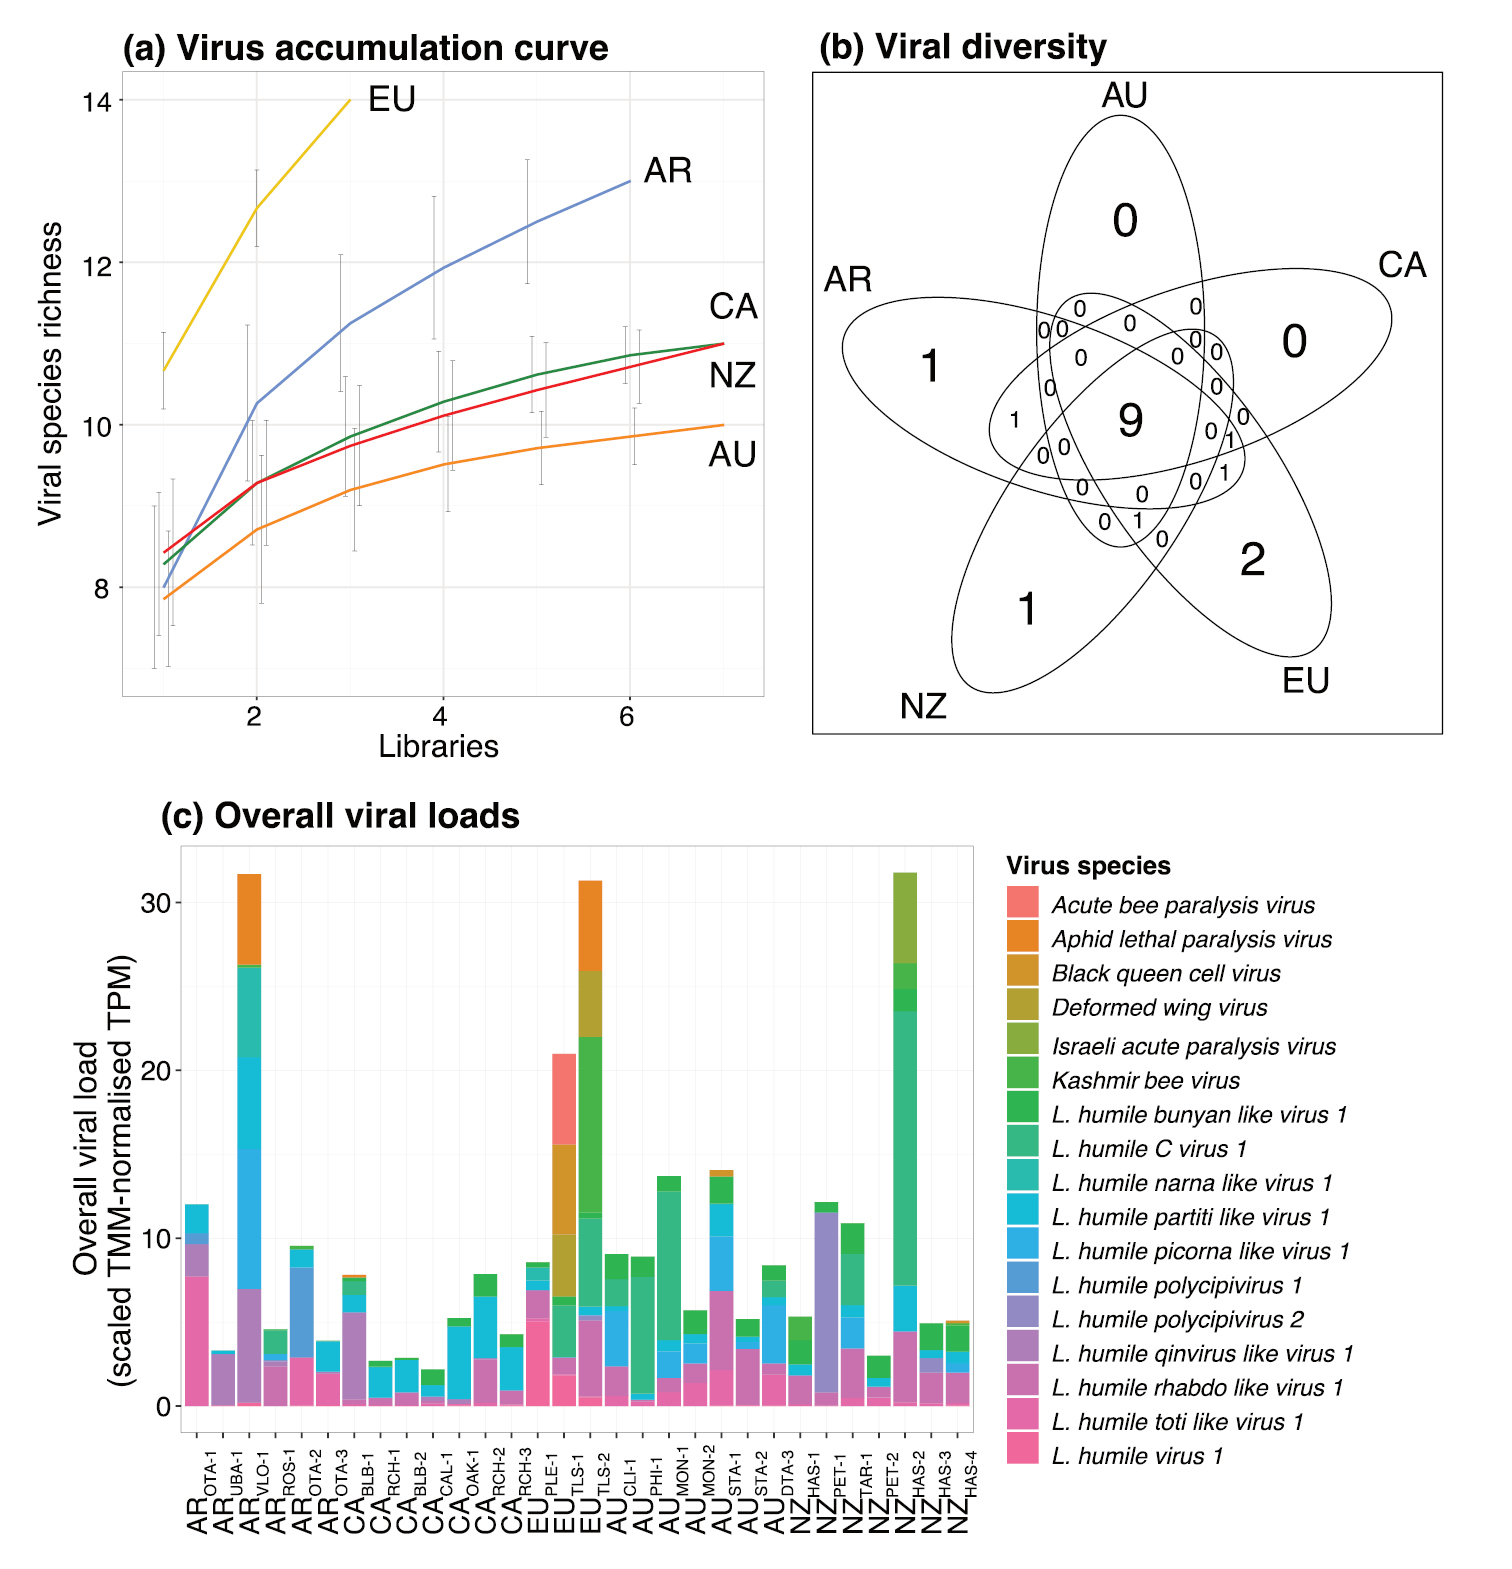
a Virus accumulation curves in Argentina (AR), California (CA), Europe (EU), Australia (AU) and New Zealand (NZ) as detected from RNA-seq data. Error bars indicate standard deviations b Venn diagram showing viral diversity and overlap amongst regions. Detail of the data is given in Table 1 c Overall viral loads per sample, showing contributions for all detected viruses in the dataset, expressed in TMM-normalised TPM scaled to the Argentine ant library size. Samples are identified with collection site and replicate in subscript (Suppl. material 1: Table S1). |