|
||
|
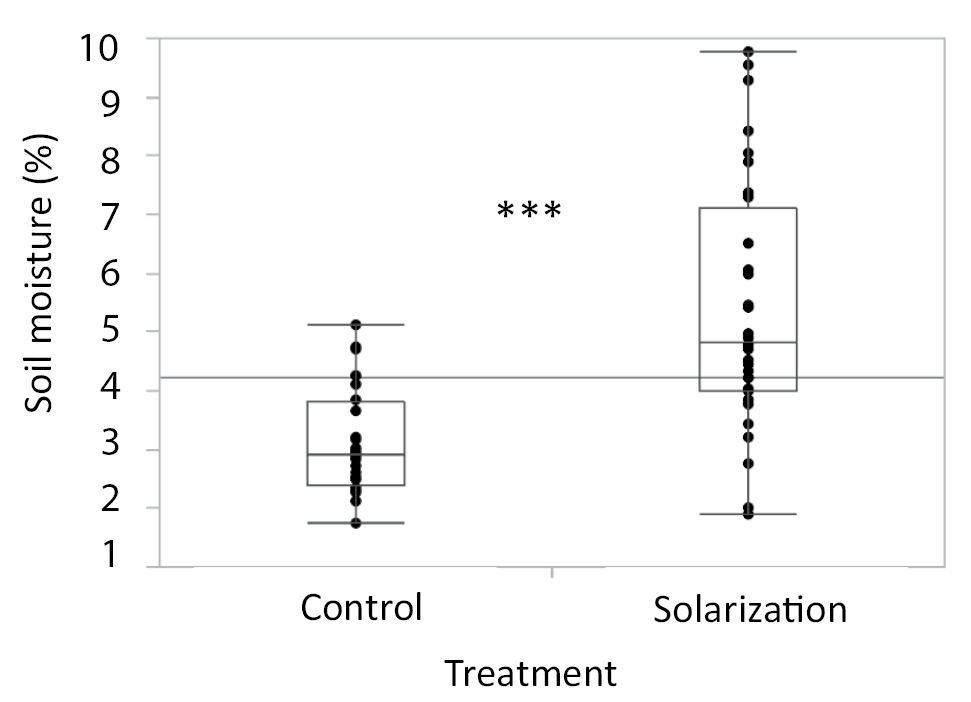
Comparison of the soil moisture between the control and the solarization treatment. Soil measurements were performed at 0–5 and 15–20 cm soil depths on four dates (4, 6, 11, and 14 weeks) after initiation of the treatment. The box-plot for each treatment includes the median, quartile, minimum, and maximum values. Points represent observations; n = four replicates × two soil depths × four experimental durations, *** = P < 0.0001 according to a post-hoc t-test (0.05) following three-way ANOVA (see Suppl. material 1: Table S1). |