|
||
|
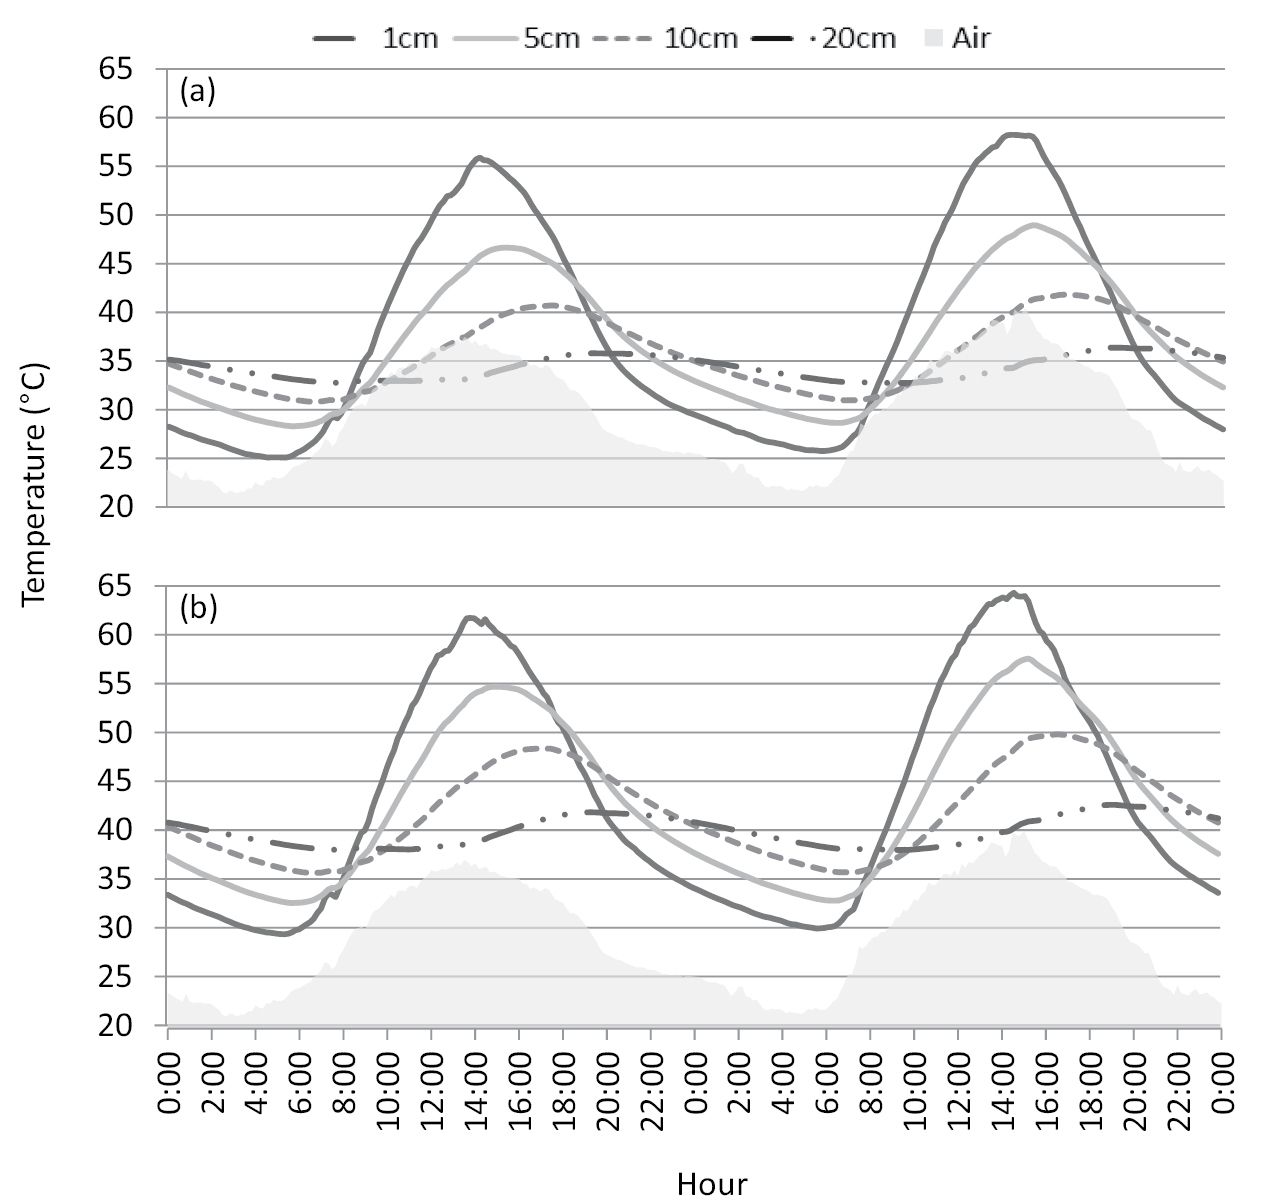
Comparison of soil temperature fluctuations in the control (a) and the solarization treatment (b) The temperature was measured at four soil depths (1, 5, 10, and 20 cm). The data represent the soil temperature during two successive days in mid-July. Air temperature is represented by the gray polygon in each figure. |