|
||
|
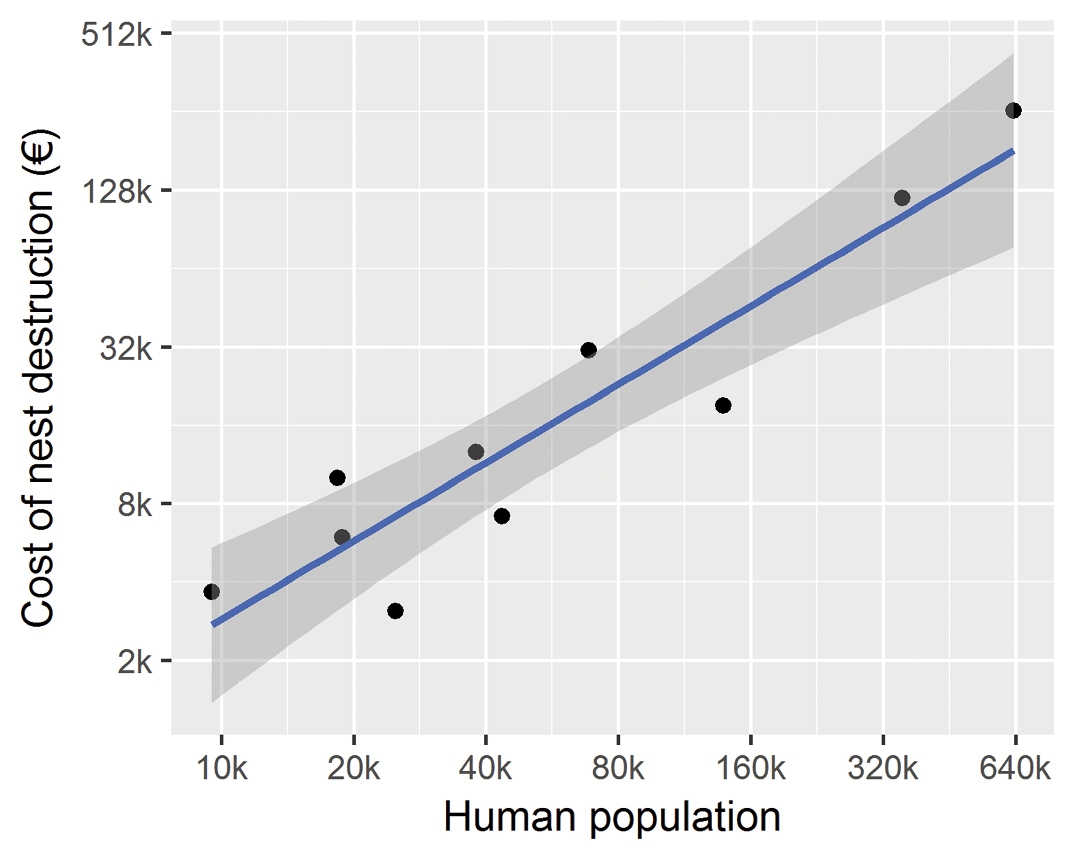
Relationship between population and the cost of nest destruction. The blue line represents the selected linear model (model 3 in Table 1). The darker grey area represents the confidence interval of the regression curve. Note that both axes are logarithmic. |