|
||
|
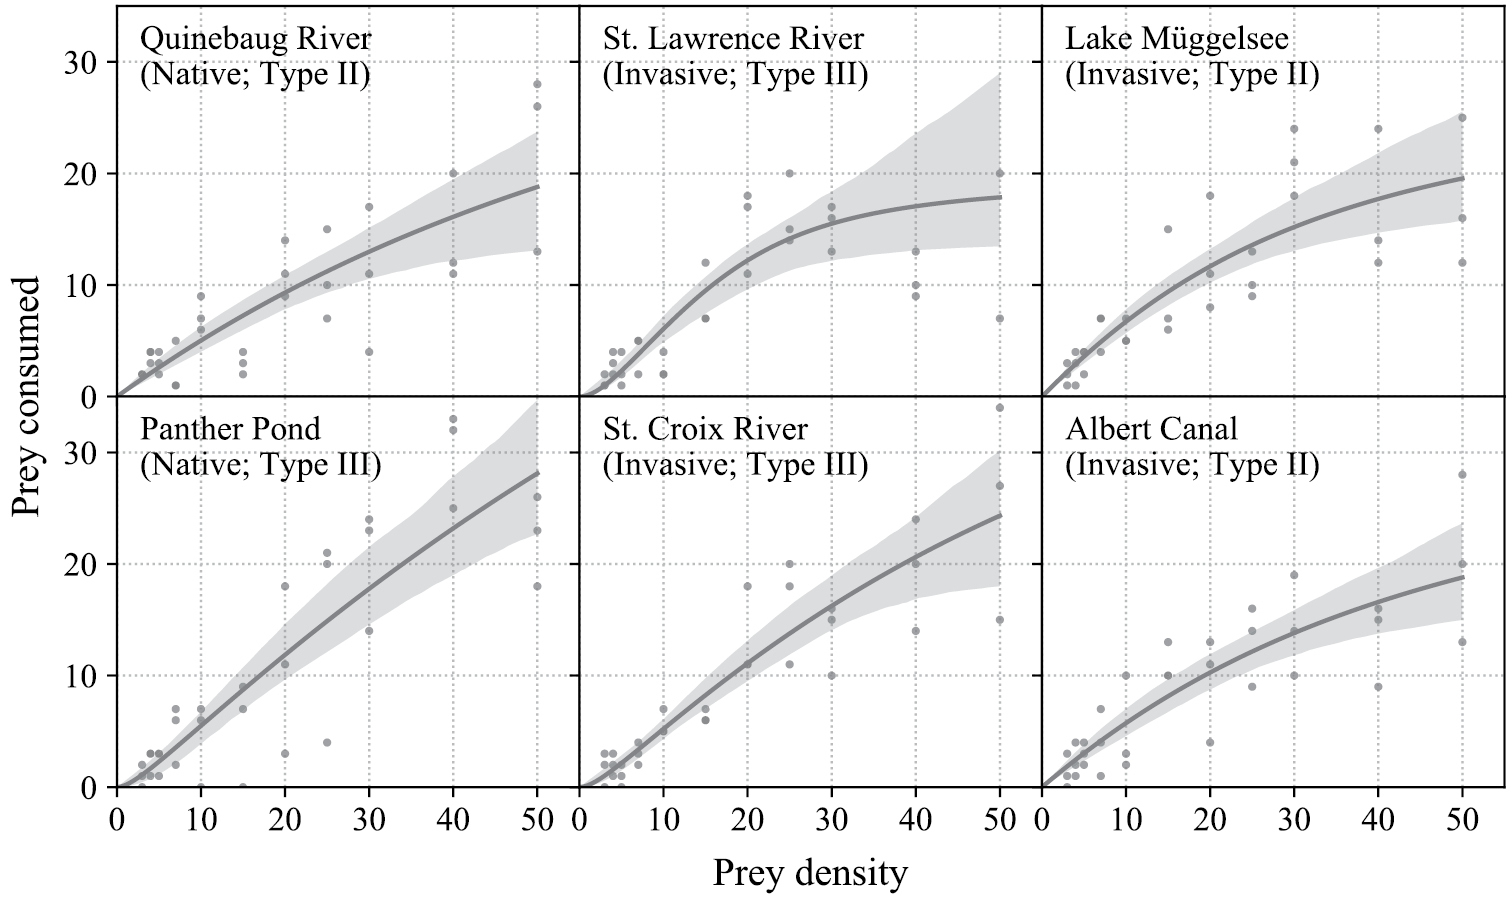
Functional response curves with bootstrapped 95% confidence intervals (shaded regions) for F. limosus from native and invasive populations. Lines represent the best fit model for each population (Type II or Type III). n = 33 for each population. |
|
||||||||
| Part of: Grimm J, Dick JTA, Verreycken H, Jeschke JM, Linzmaier S, Ricciardi A (2020) Context-dependent differences in the functional responses of conspecific native and non-native crayfishes. NeoBiota 54: 71-88. https://doi.org/10.3897/neobiota.54.38668 |