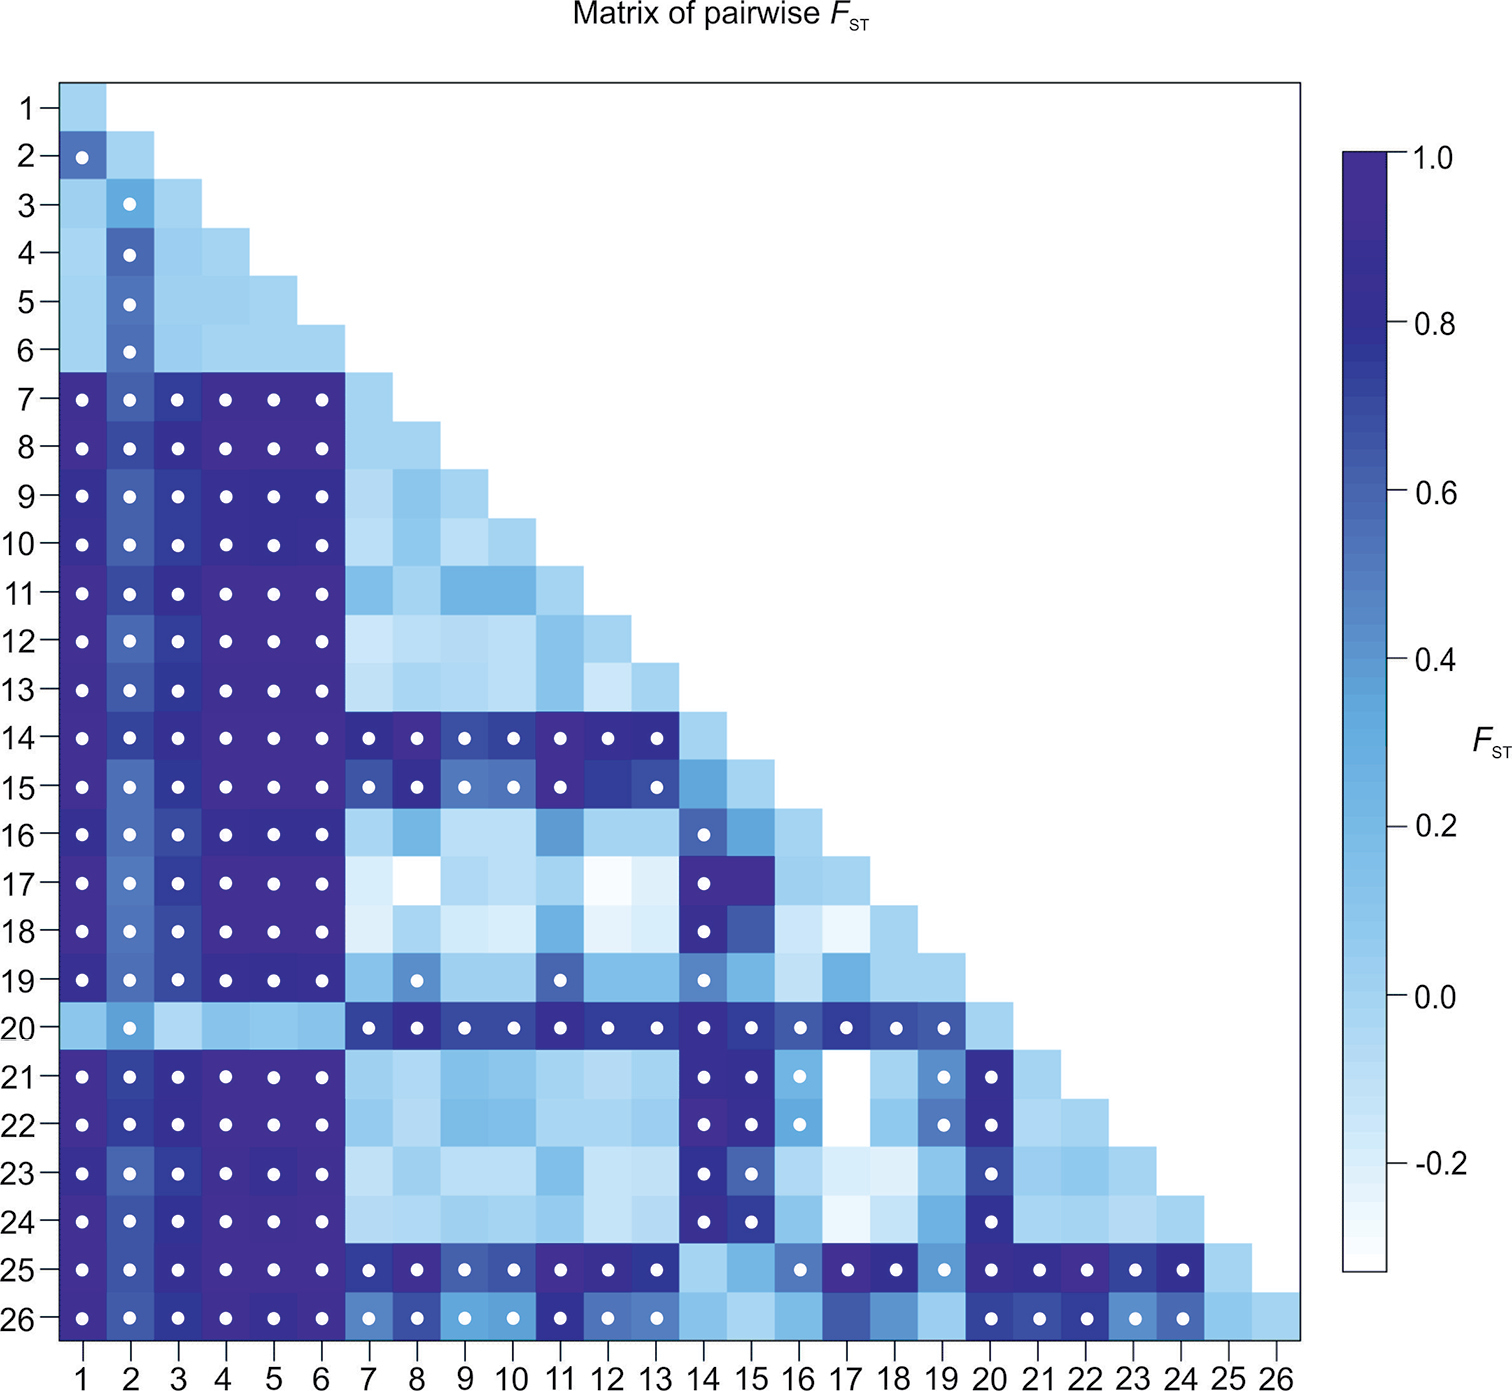
Population connectivity illustrated by a matrix of pairwise FST values (see also Table S2). White dots indicate FST P values significantly different from zero (P <0.05). Sites in close geographic proximity pooled for demographic analyses and assigned the same number.


  Part of: Grabowska J, Kvach Yu, Rewicz T, Pupins M, Kutsokon I, Dykyy I, Antal L, Zięba G, Rakauskas V, Trichkova T, Čeirāns A, Grabowski M (2020) First insights into the molecular population structure and origins of the invasive Chinese sleeper, Perccottus glenii, in Europe. NeoBiota 57: 87-107. https://doi.org/10.3897/neobiota.57.48958